Release Highlights - Datacenter

19.20 Datacenter Highlights
Reporting - Cycle group actions
You can now report on the actions of participants in currently running cycles using the following IQL properties: acknowledgementGroupActions, approvalGroupActions, endorsementGroupActions, reviewGroupActions
Available sub properties are the cycle group name, user, username, user’s linked resource, action taken, date action taken, and comment. This enhancement provides quick insight into activity across all active cycles and enables easier export of cycle action data to external systems via the REST API.

Diagram side panels
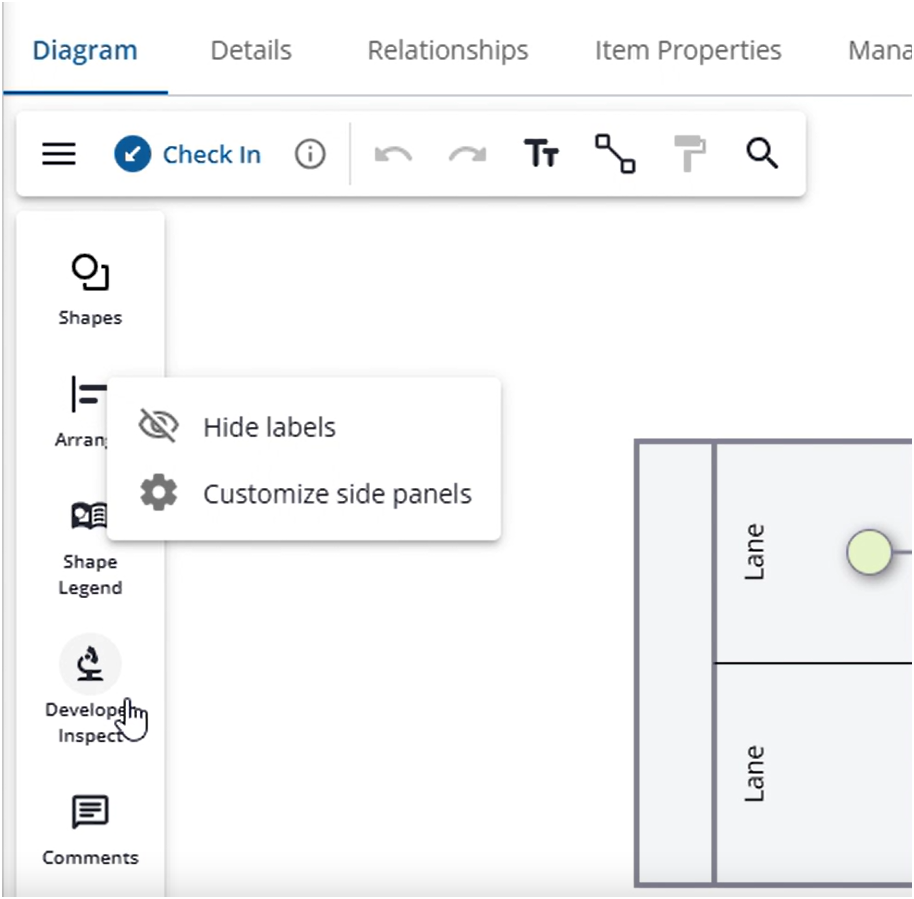
We introduced an easy way to configure your diagram side panels - right-click the panel to hide it or to access the side panel menu for more options.
Change-in-behavior: Better support of custom shapes
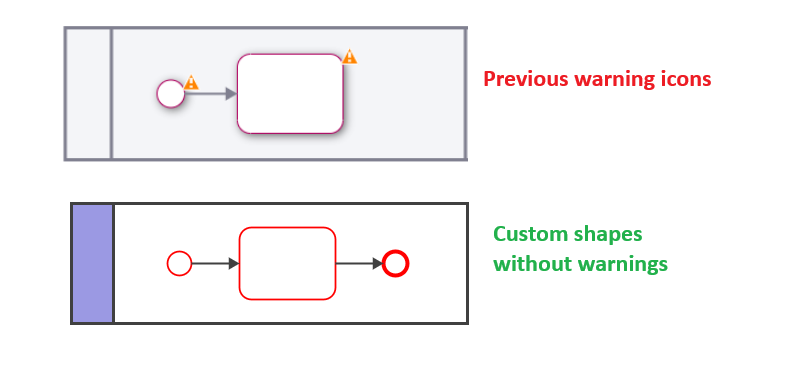
Previously, custom shapes displayed a warning in BPMN diagrams stating that only generic artifacts should use custom symbols, even when the shapes themselves were BPMN-conforming.
With this update, that warning has been removed to better support the use of custom shapes in BPMN-type diagrams. Standard BPMN validation and error checking continue to apply as before.
Change-in-behavior: Honor original editing language
Previously, when a proposed object was accepted in a diagram, the object was created using the accepting user’s profile language.
With this update, the system now honors the original editing language of the user who proposed the object. This applies to the object itself as well as its summary, purpose, and instructions.
This change ensures greater consistency in multilingual environments and preserves the original author’s intent when collaborating across languages.
Proposing new objects from within a diagram
SMTP Support for Microsoft Exchange Online
iGrafx now supports SMTP integration with Microsoft Exchange Online, allowing organizations to use their Exchange Online configuration for outgoing email from the application.
This enables better alignment with corporate email policies, improved deliverability, and centralized management of mail flow, authentication, and security settings through Exchange Online.
Instructions and more: How to send emails via SMTP with OAuth using Microsoft Exchange Online
Reporting - Approval Effective End Date
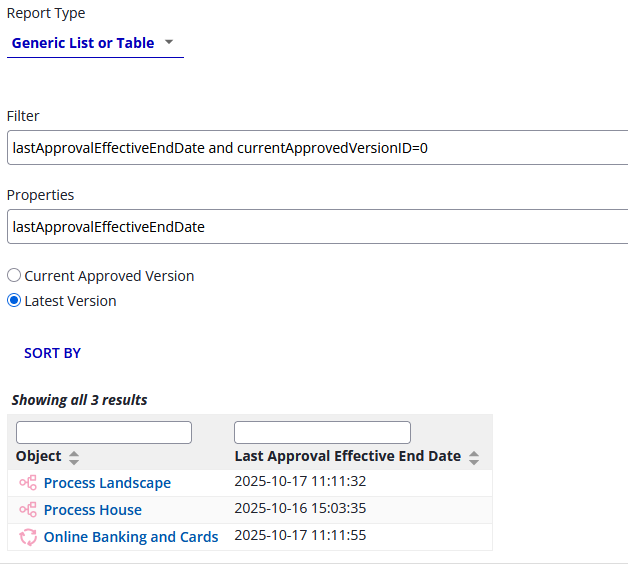
We added a new IQL property, lastApprovalEffectiveEndDate, so you can report on the last date that an approval was revoked for an object. This information can be used for your data retention wokflows.
To filter out currently-approved objects, you can combine the following filters properties:
lastApprovalEffectiveEndDate and currentApprovedVersionID=0
Modernized Manage Cycle Group UI
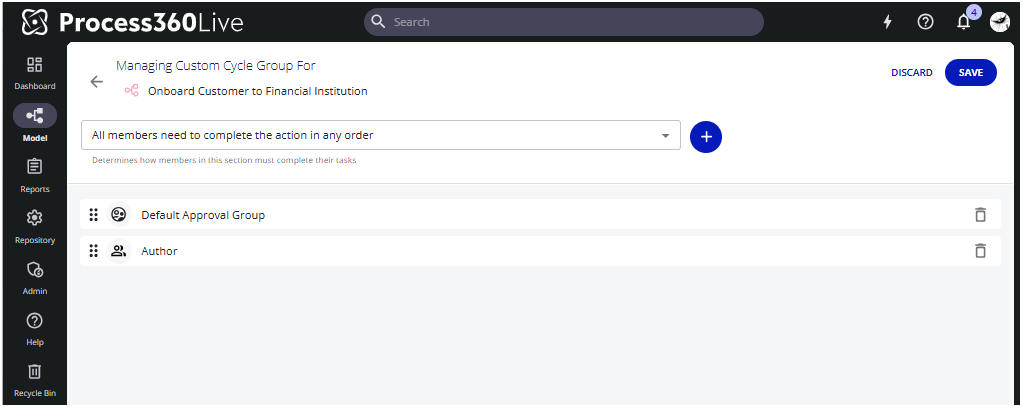
We have updated the Manage Cycle Group UI to a new modern look and feel.
New user display name option
If you are using multiple user directories, we now allow to add the directory to the username’s display name to easily identify which directory a user belongs to.
To configure the display name, go to Administration → Customization → User Display Names
Early Access
![]() Early Access features require your system administrator to enable them for your entire organization. How to enable Early Access features
Early Access features require your system administrator to enable them for your entire organization. How to enable Early Access features
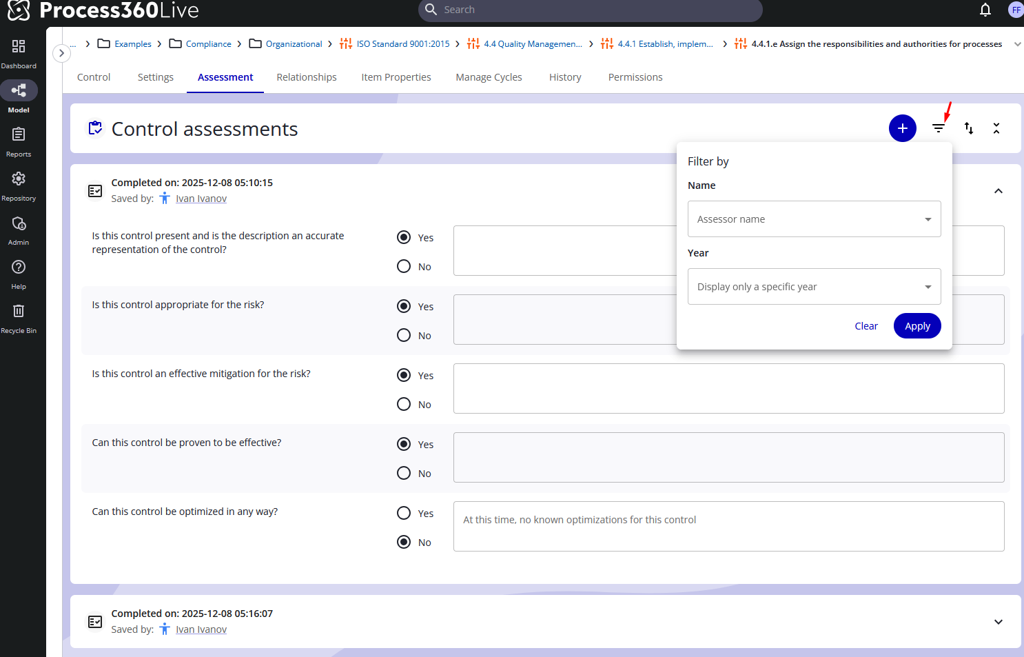
New: Control assessment
Control objects now have an assessment tab where users can review and assess the control data by answering pre-defined questions. This allows you to track the current control validity and to properly audit the assessment. To automate workflows, we also have added new API endpoints.
For more details: Control Assessments
New: Narrative configuration UI
Get a first glimpse into the new user interface for the report settings. This allows you to prepare documentation or test out the new user experience when configuring the narratives,
Learn more about Narratives
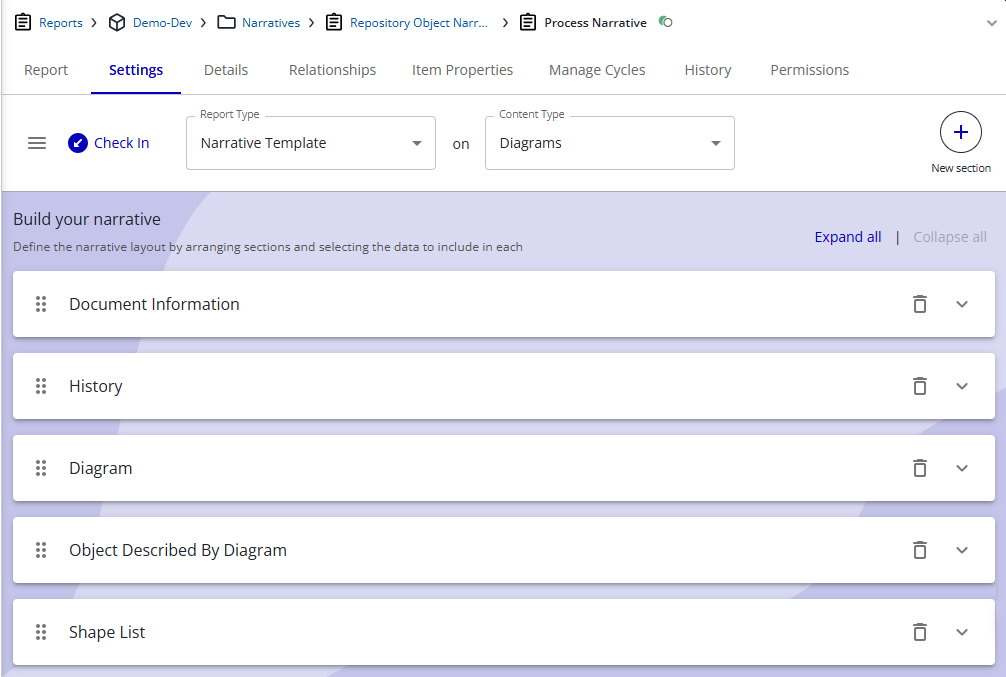
Narrative Settings UI
New: Recent History
As administrator you can now enable the Recent History panel for your users. When enabled, users will see a new icon in the top navigation bar that opens a dedicated panel showing recently visited objects of the logged-in user. In addition, breadcrumbs will then display the ancestor path of the current object, making it easier to understand context and navigate.
Recent History is retained across logout and login as long as the user stays within the same browser tab. To clear the object history, open the application in a new browser tab.
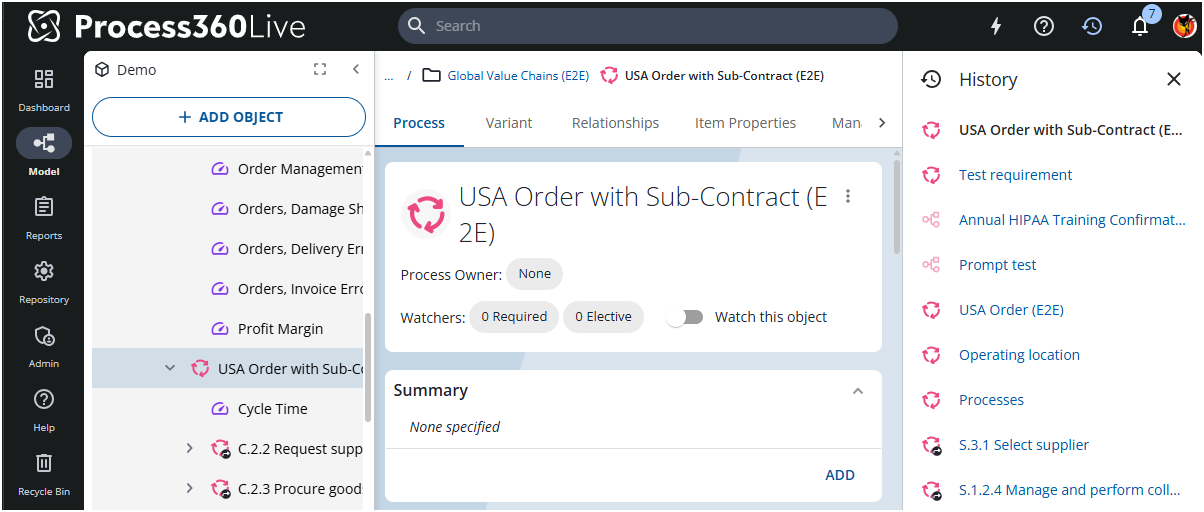
More details: New Recent History Panel
Deprecation
API - Removal of the old documentedbyurl endpoints
With this release the old documentedbyurl endpoints are removed from the platform. Please follow this link to switch to the new end points right away: Deprecation Notice
