Process Simulation in the iGrafx Platform
Cloud only feature
Description
This page discusses the discrete event simulation engine feature.
You can now create a simulation model for a process using the web diagrammer. You can get the results of running it and/or watch the simulation running live.
To get started, you can either use an existing diagram as a starting point, or start with a blank diagram. The simulation will be stored in a Simulation Project object which will contain all things relating to the simulation.
Note: A Simulation FAQ page is available in the Product Blog.
Note: There are sub-pages to this page that have more information; please see the tree (by default on the left hand side of your browser window).
Important! Your network must be configured to allow Websocket connections in order to run simulation.
Starting with a new diagram
Go to the location you want to store the Simulation Project in, and create a Simulation Project object.
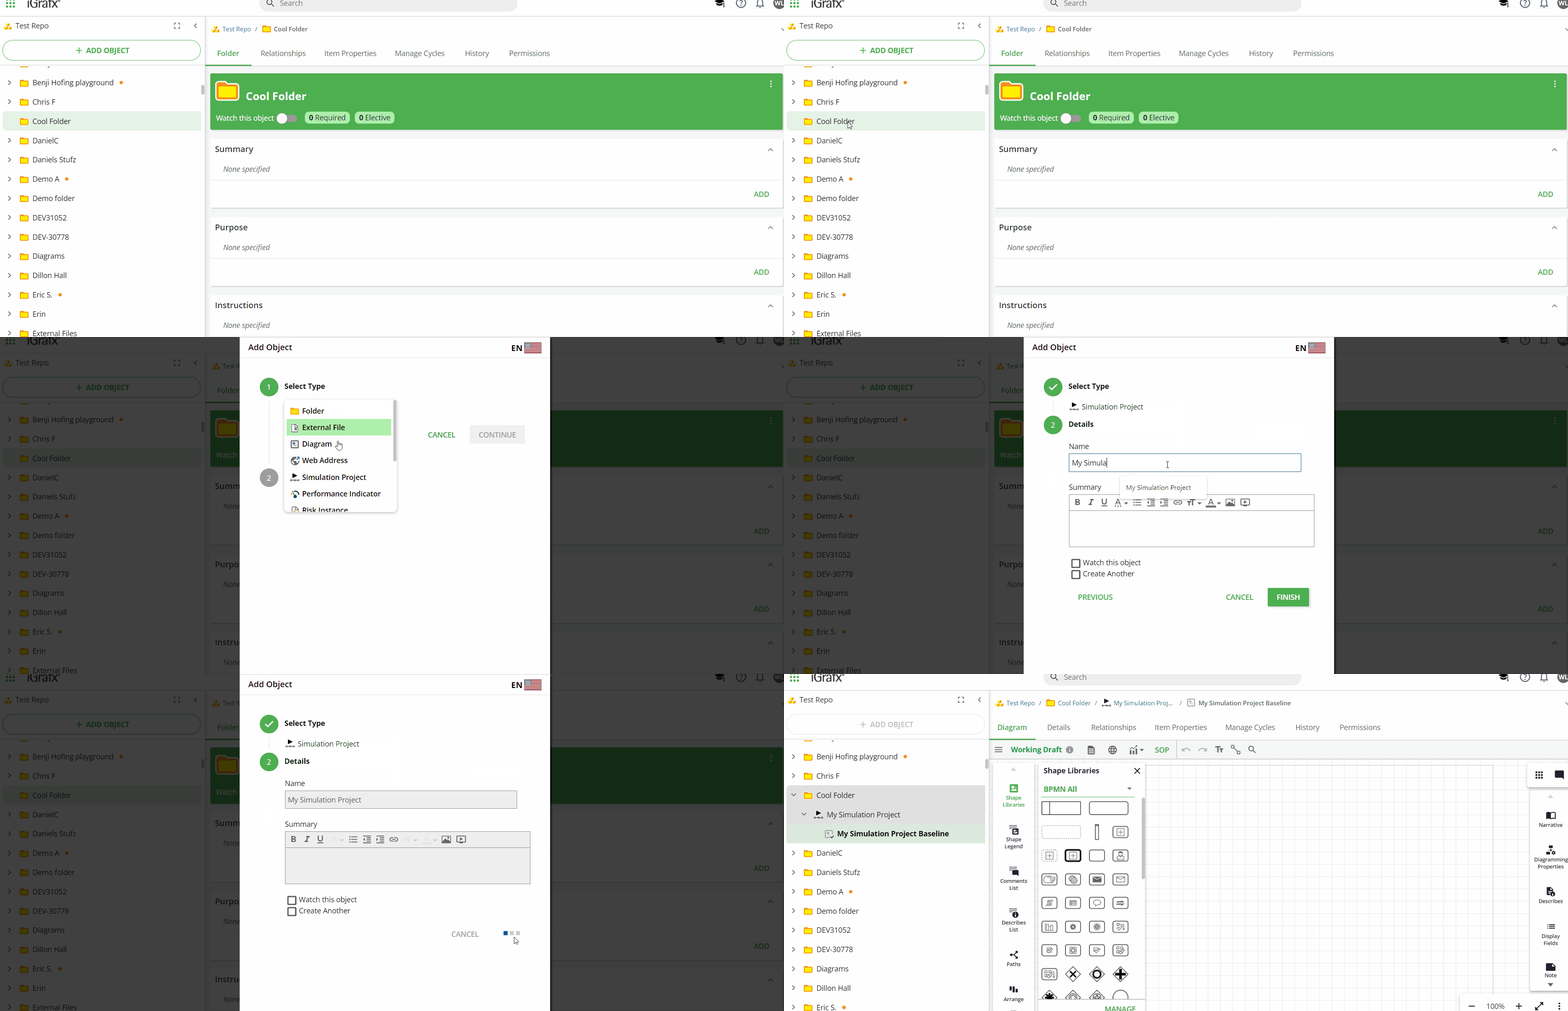
Starting with an existing diagram
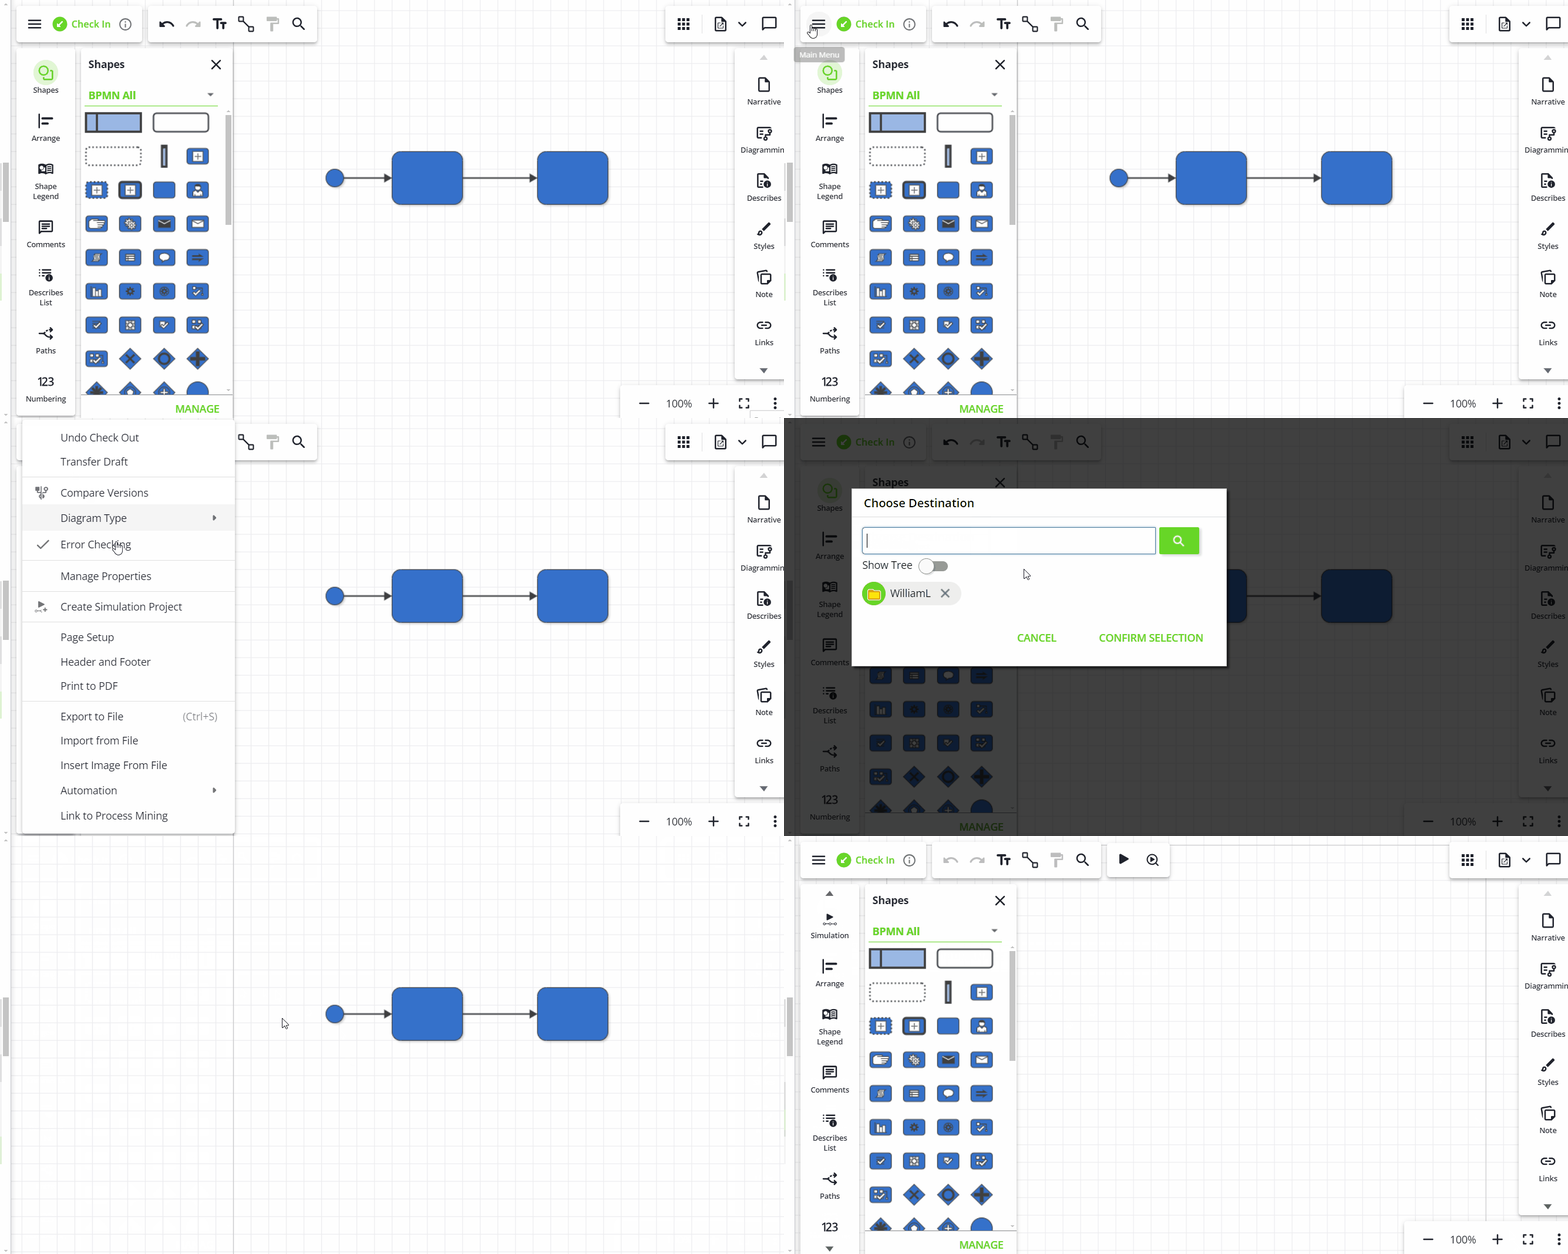
Note that the diagram should be checked in. Any changes made since the last check in won’t show up on the new diagram.
Go to the diagram.
Go to the Main Menu and click Create Simulation Project.
Getting started with simulation
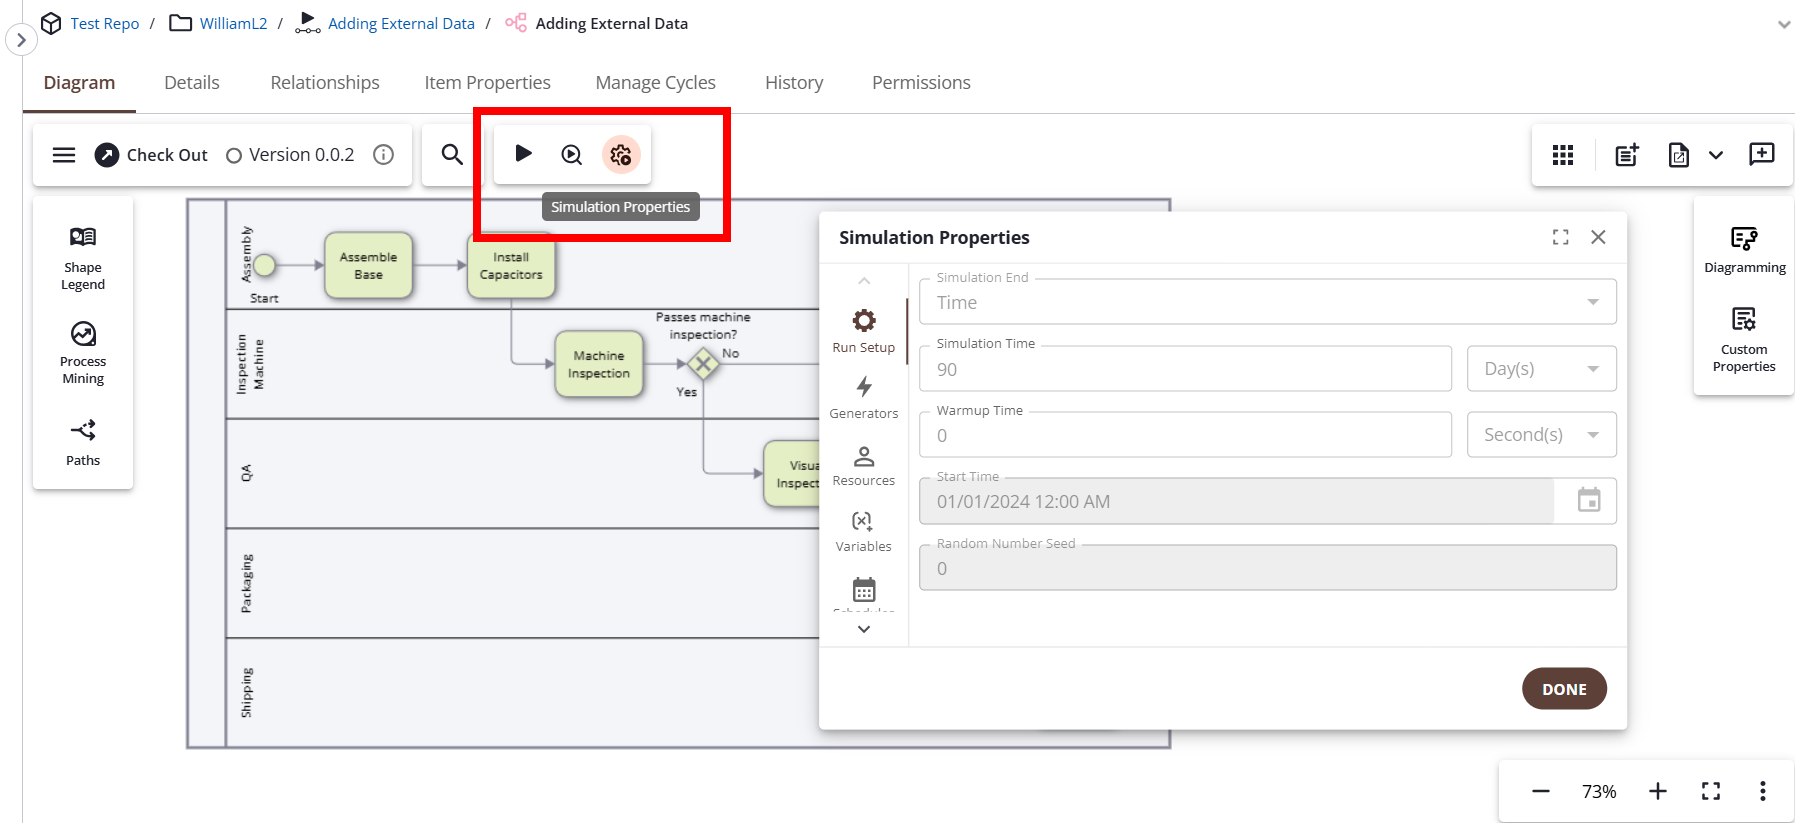
Click the Simulation Properties icon. The Simulation Properties dialog will appear. To hide this dialog, click Simulation again. The dialog can be resized to the size you like as long as it isn’t expanded.
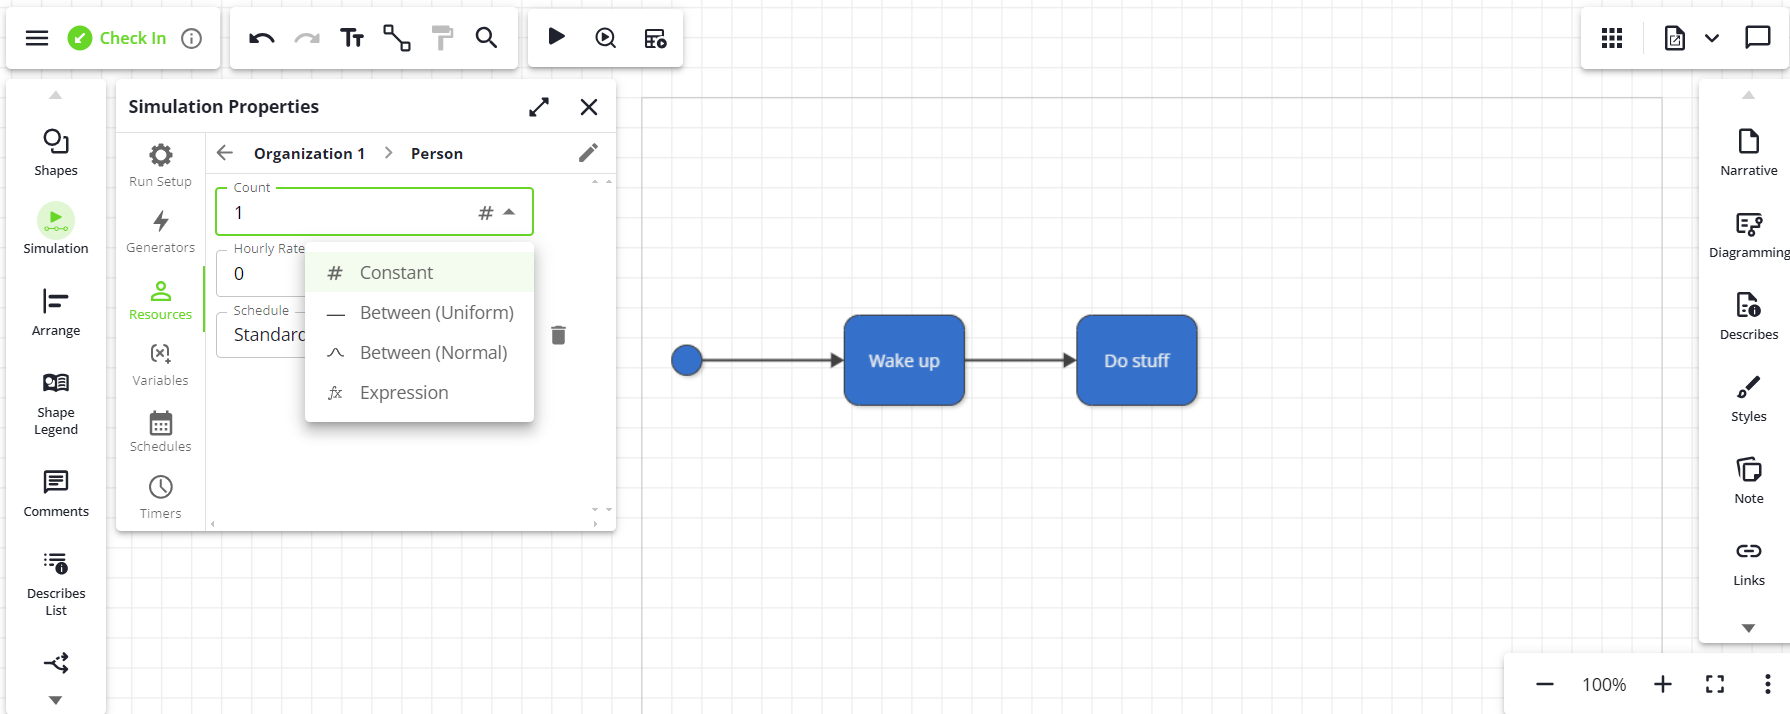
If a shape is selected, the Simulation Properties dialog will show the properties for that shape. If no shape is selected, the dialog will show properties for the whole simulation. You can also select a connector line to add a duration for it.
For help building more complex expressions, change the type of the input box using the dropdown. Selecting “Expression” will enable autocomplete with suggestions for variables present in the model and built-in functions.
Running the simulation
Clicking Run will run the simulation and then display results.
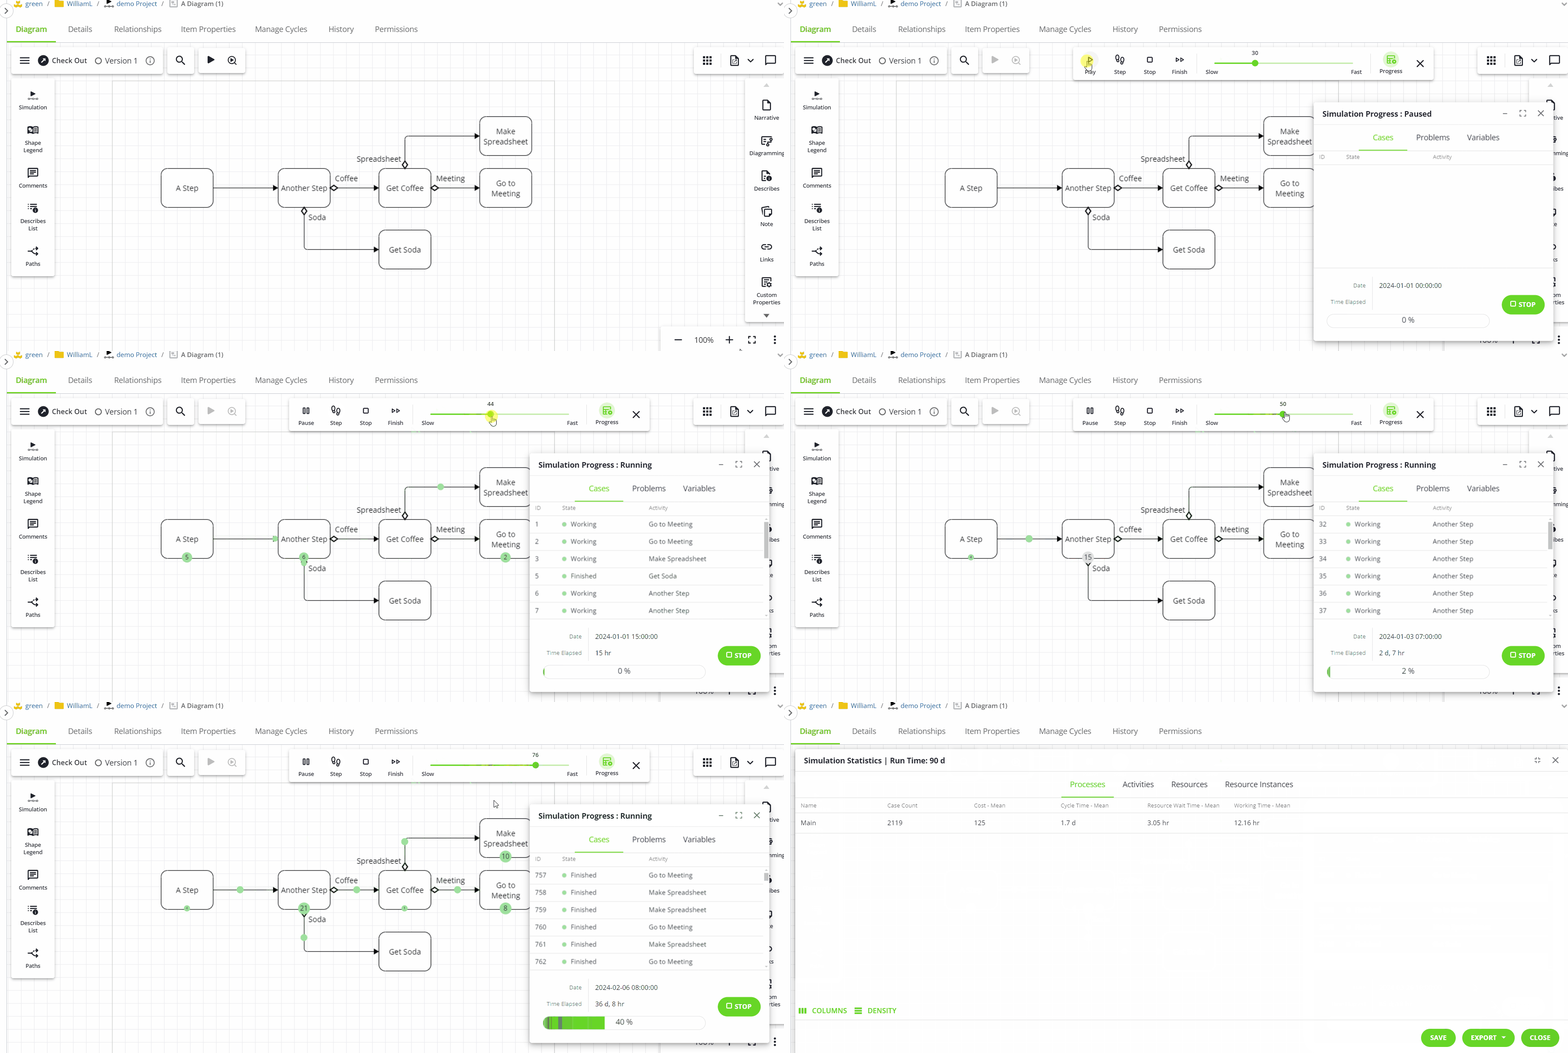
Clicking Trace opens up a more interactive view. You can:
Watch cases move through the simulation
Adjust the speed
Note that the speed slider is on an exponential scale. Every 5 units represents about a 2x increase in speed. For example, moving the slider from 40 to 60 will cause much more than a small increase: the simulation will go 16x faster.
Play/pause
Fixing problems
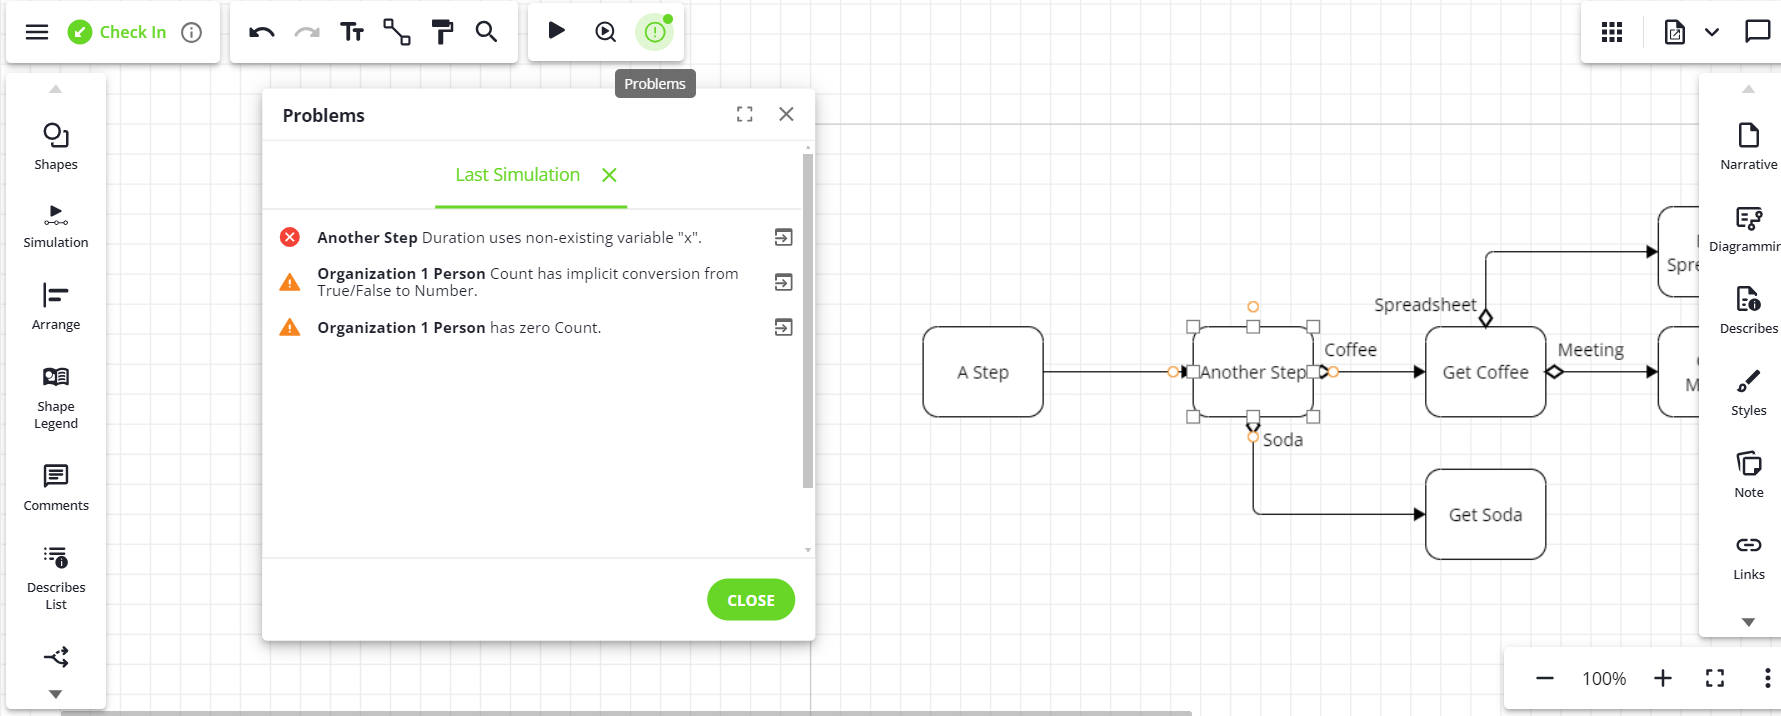
If the simulation model has invalid parameters, then a ‘Problems’ dialog will be displayed showing where the problems are. Problems that prevent the simulation from running are displayed with a red ‘x' error icon, while problems that potentially produce unexpected results are displayed with a yellow triangle with an '!’ warning icon.
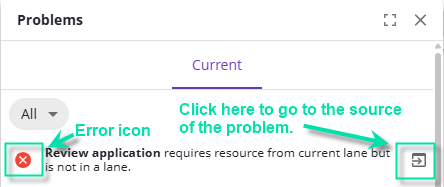
Problems dialog with example error
The dialog can be opened and closed using the Problems icon in the simulator toolbar.

Simulator toolbar, with Problems dialog button highlighted
Most warnings will have a navigation icon on the right and/or clickable links that take you to where the problem is. Some warnings (for example, if the model has no active generators) do not have navigation links.
Also, please see our Simulation - Troubleshooting documentation page for more information and ideas on fixing problems or debugging your simulation model.
Results
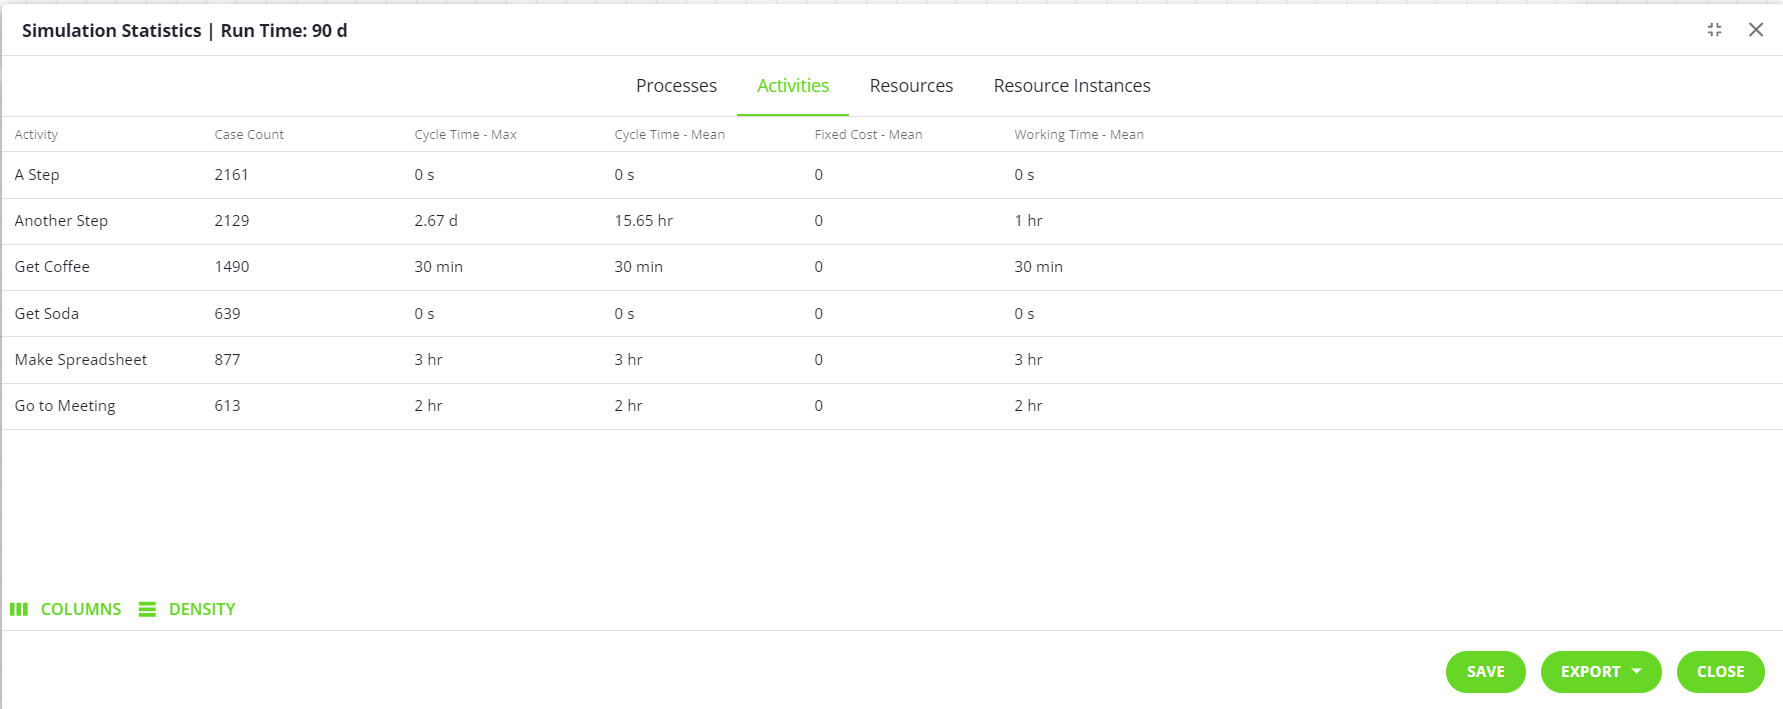
Once the simulation finishes, results will be displayed. You can choose to save the results to a Simulation Results object, or export them. All the results are saved, regardless of which ones are selected to be visible from the Columns option.
If you choose to save to a Simulation Results object, the object will be saved to the Simulation Project folder, and you can view them later by going to the object.
Note: If you’re wondering what each of the statistics referenced measure, we are still working on documentation. However, the reference at the Desktop Client Statistics Reference should provide helpful information, provided you change any reference of ‘Transaction’ to ‘Case,’ ‘Average' (or ‘Avg’) to ‘Mean,' and ‘Total’ (or ‘Tot’) to ‘Sum.'
Comparing results
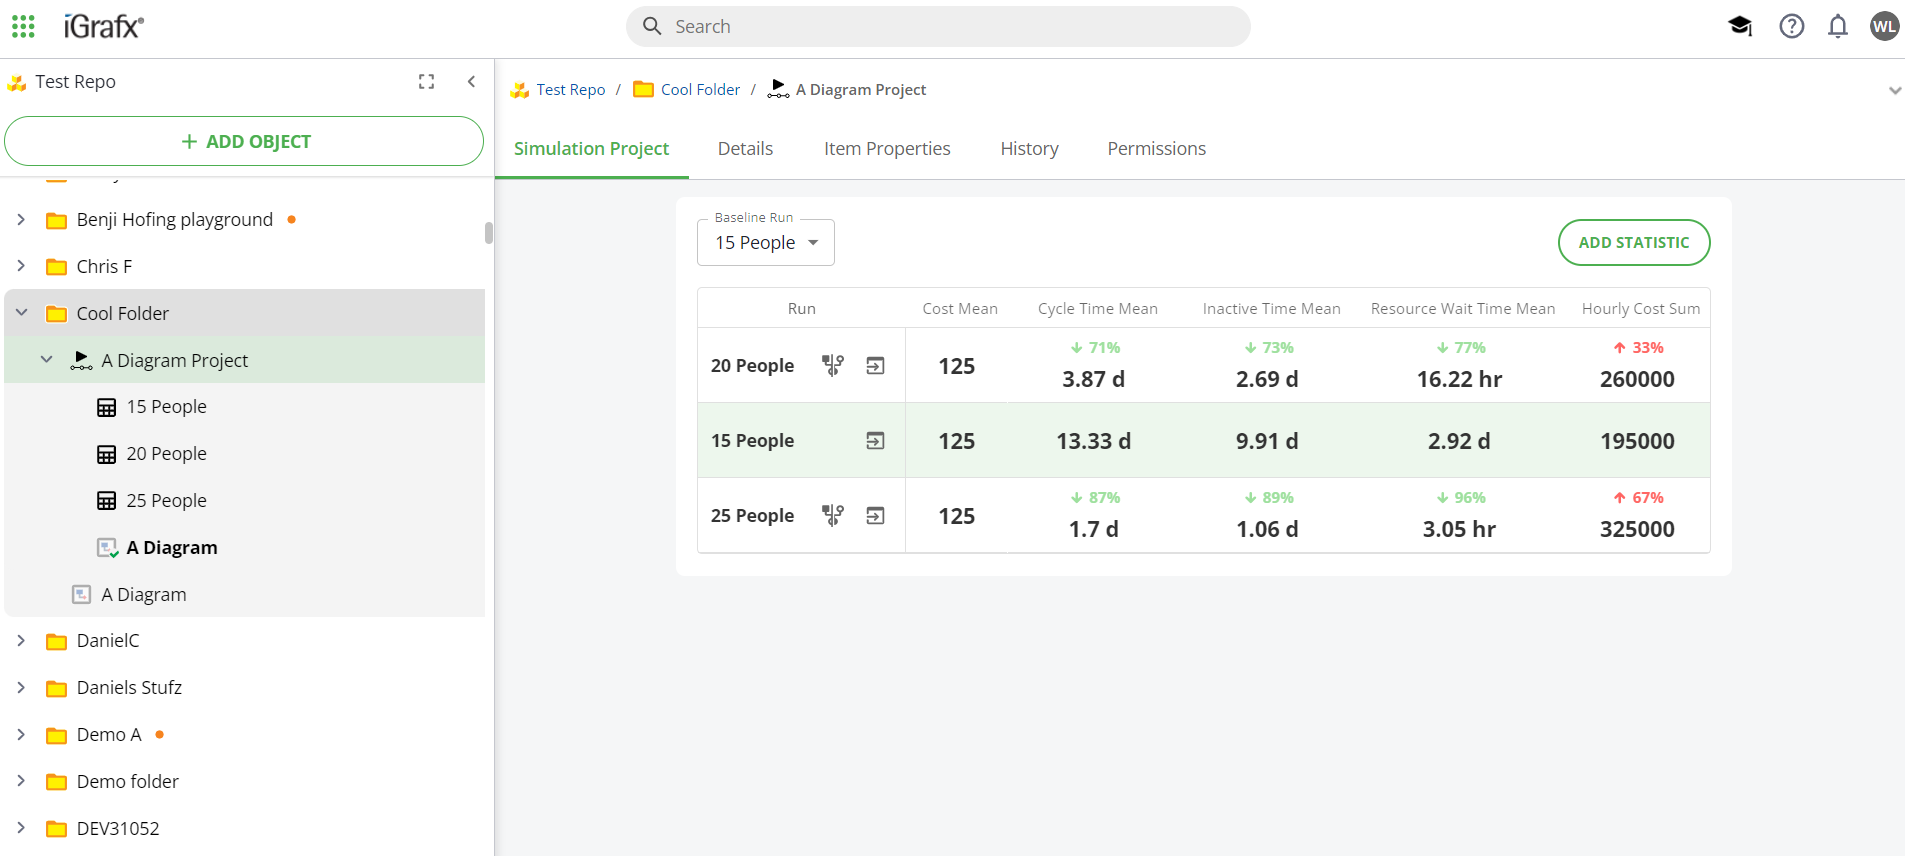
You can compare multiple sets of results to see which one best produces your desired outcome. Click on the Simulation Project object to compare all the results saved in the project.
To see what changed in the diagram from the baseline to produce the different results, click on the “Compare with baseline run” button.
Troubleshooting
My simulation does not run and I get a dialog titled “Problems (Last Simulation)”
See the section “Fixing Problems” above.
My simulation does not make any progress
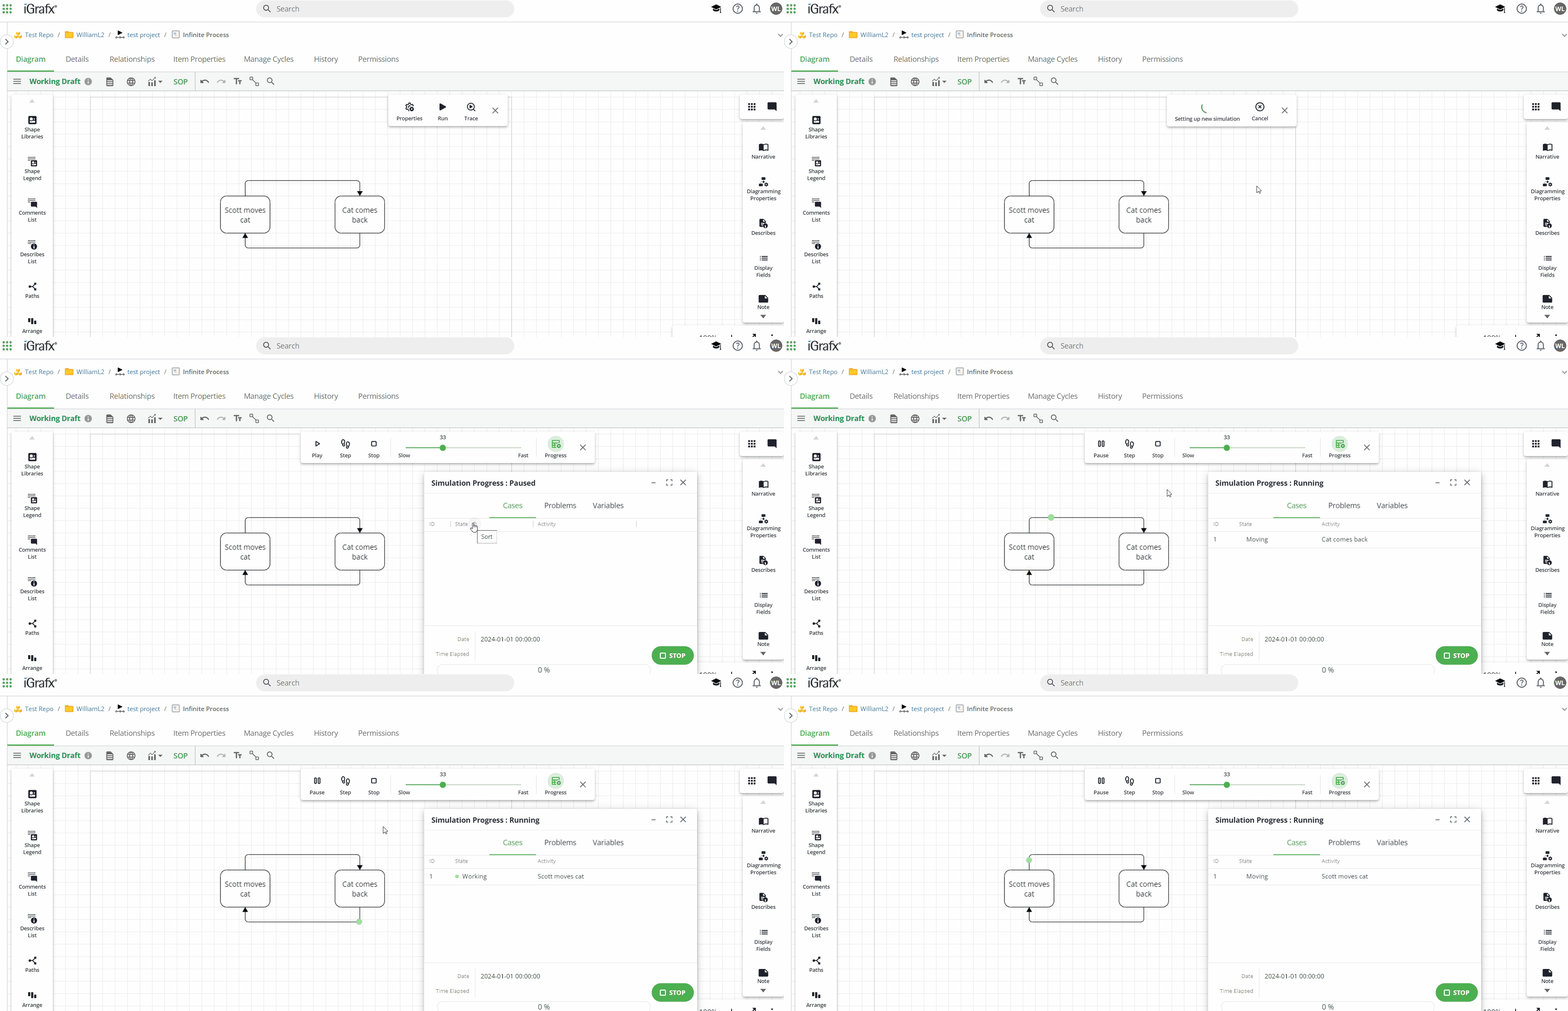
It is possible your simulation contains an infinite loop. If a case moves in an infinite loop of activities that take no time to complete, the simulation clock will not advance. This can be seen if you run the simulation in Trace mode.
Note: Again, a reminder that there is more simulation documentation available! Please see the tree for the ‘sub pages’ under this one, or click on the following links:
