Simulation Results
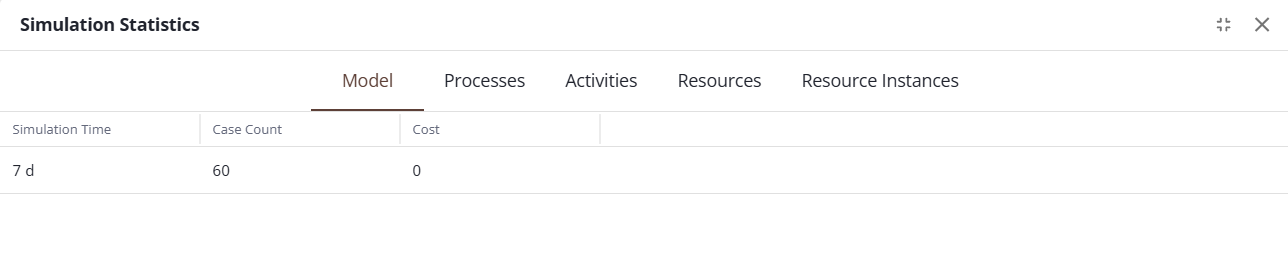
The tabs on the top of the results highlight different aspects of the results.
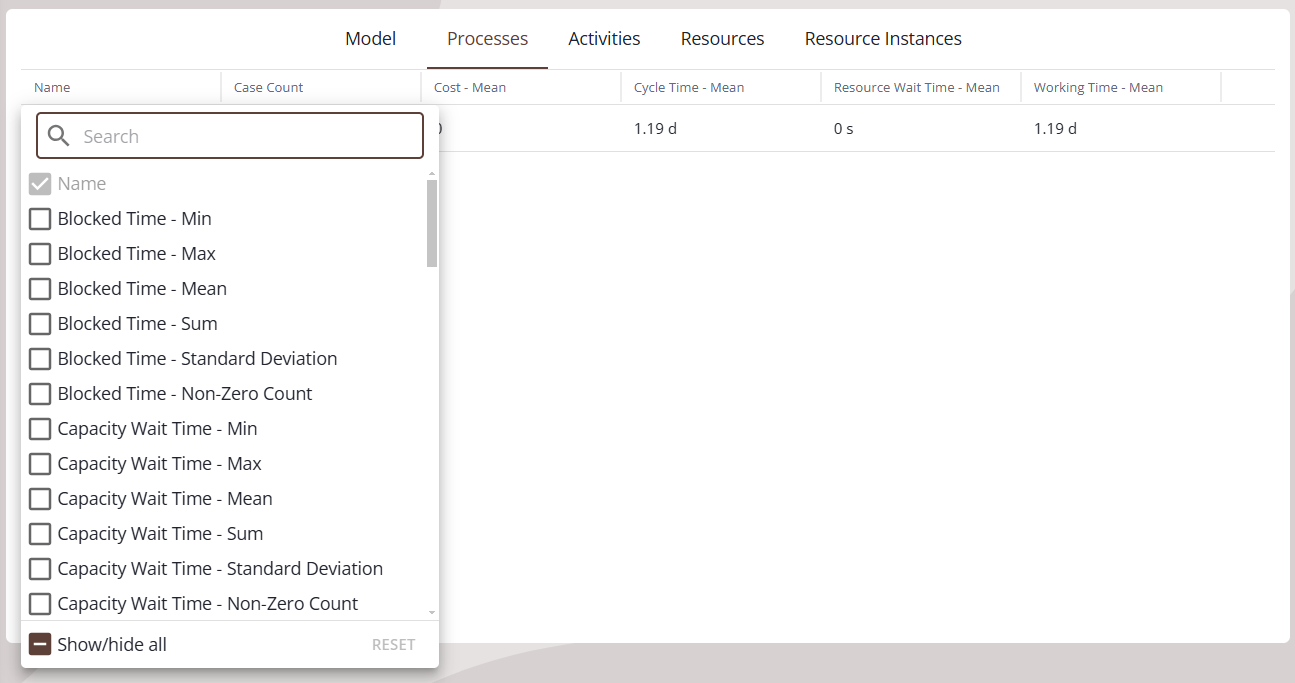
Clicking “Columns” shows options for which statistics to view.
Model
Shows totals across the entire simulation, e.g. the total cost for the simulation.
Processes
Each pool in the diagram represents a process. For each process, shows statistics relating to the cases going through that process: see Case State Statistics.
Each case counts as one observation. For example, if there are 3 cases going through a process, and they spent 4, 6, and 11 total hours working, then Working Time - Mean would be 7 hours for that process.
Activities
Shows statistics for each individual activity.
Shows case statistics: see Case State Statistics. Each case counts as one observation: for example, if there are 3 cases going through the activity and they spend 4, 6, and 11 hours working at the activity, then Working Time - Mean would be 7 hours for that activity.
Also shows counts for the case statistics. For example, Working Count - Max shows the maximum number of cases working at the same time at that activity for the whole simulation. “Total Count” counts all cases at the activity, so for example Total Count - Max shows the highest number of cases at the same time at that activity.
Cost is divided into Fixed Cost and Resource Cost, also recorded per case. Fixed Cost is the cost per case defined in Task properties, and Resource Cost is the cost of the required resources used.
Resources
Shows statistics for each group of resources defined in Resources.
Shows Resource State per group, for example if there are resources of type Person in organization Sales, with a count of 3, and in a 90 day simulation they spend 20, 22, and 27 days working, then Working Time - Mean will be 23 days for that group.
Also shows other resource statistics, for example Wait Queue Size - Mean is a time weighted average of the number of cases waiting for this resource.
Resource Instances
Shows Resource State and cost, but for each individual resource instance. For example if there are resources of type Person in organization Sales, with a count of 3, all 3 will have individual statistics.
Case State Statistics
Cycle Time: The total time taken (for a Process, total time to go through the process, for an activity, total time to go through the activity).
Blocked Time: Time spent waiting at Input Gates.
Capacity Wait Time: Time spent waiting because an activity with Capacity was full.
Inactive Time: Time spent waiting because an activity or required resource was not in schedule.
In Transition Time: Time spent in a transition. To set a duration for a transition, click on the transition and open the Simulation Properties dialog.
Resource Wait Time: Time spent waiting to acquire resources.
Service Time: Total time not waiting for a schedule. Cycle Time minus Inactive Time.
Wait Time: Total time spent waiting for any reason. Cycle Time minus Working Time.
Working Time: Time spent actively working on activities. Includes overtime, but does not include inactive time.
Resource State Statistics
Acquired Waiting Time: Time spent acquired by a case, but waiting for another resource to be available.
Idle Time: Time spent in schedule, but not acquired by any case.
Out Of Service Time: Time spent out of schedule and not working overtime.
Overtime: Time spent out of schedule and working.
Working Time: Time spent actively working on a case.
Resource Pool Statistics
Hourly Cost: The cost per hour of the type, when scheduled.
Per Use Cost: A cost that occurs when the resource is acquired.
Wait Queue Size: The number of cases waiting for this resource.
Non-Zero Waiting Time: Whenever a case tried to acquire this resource and could not do so right away, records the amount of time spent waiting.
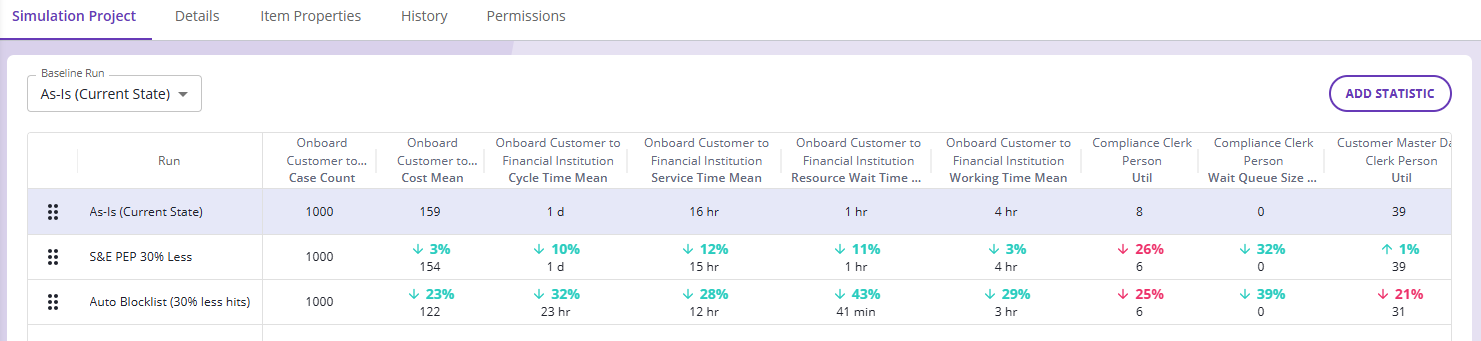
Simulation Project View
Statistics are also shown when you select a simulation project (shown on the ‘Simulation Project’ tab). This view will show a summarization of key statistics from all of the Simulation Results you have saved.
In addition, it will also show the approximate percentage change between the ‘Baseline Run' (which you may select) and each subsequent run. The Simulation Project will automatically make assumptions about whether the change is good (green) or bad (red), and show an arrow to indicate whether the number has increased (up-arrow) or decreased (down-arrow). You may indicate whether higher values or lower values are better; hover over the column header, click the menu (three vertical dots), and make your selection.
You may also control the number of decimal places shown in the menu, if you need more, or less, detail to make the comparison clearer. For example, a statistic may be truncated, and show a small percentage change for what looks like the same number. Let’s consider the case where the comparison shows a statistic of 4 hours in two simulation runs, and yet the comparison also shows 3% reduction. If you increase the number of decimal places shown, you will be able to see the precise number used for the calculation.