Cloud only feature
Overview
The External Data Object can be very useful for providing data for various uses within Process Design. For example, you can use it for the following:
-
As input for an External Data Generator in your Simulation models (creating cases based on tabular data input, including from Process Mining logs)
-
For values of Custom Properties in a diagram (e.g., for analysis in the Metrics Panel and/or VSM diagrams)
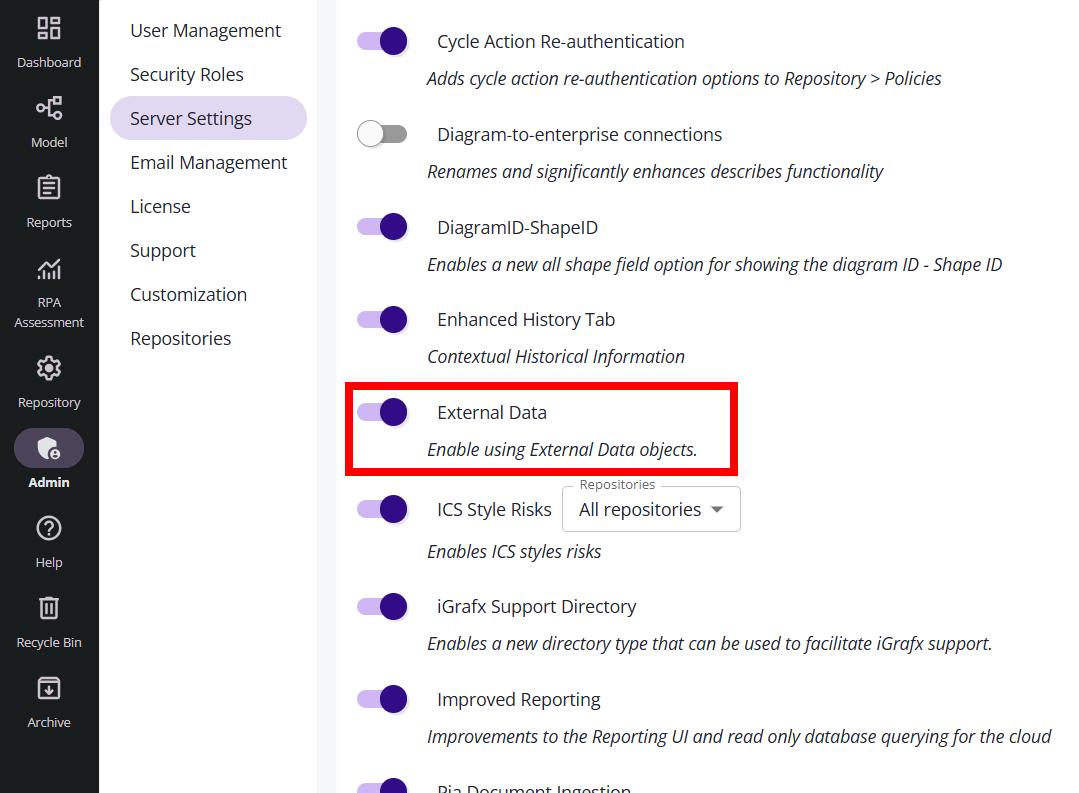
Feature Controlled by Feature Flag
This feature is under a feature flag. To access it, a server administrator must go to the Server Settings page under Administration, and turn on the External Data feature flag.
Creating and Uploading (Populating) External Data
The following describes how to set up an object representing data that can change over time.
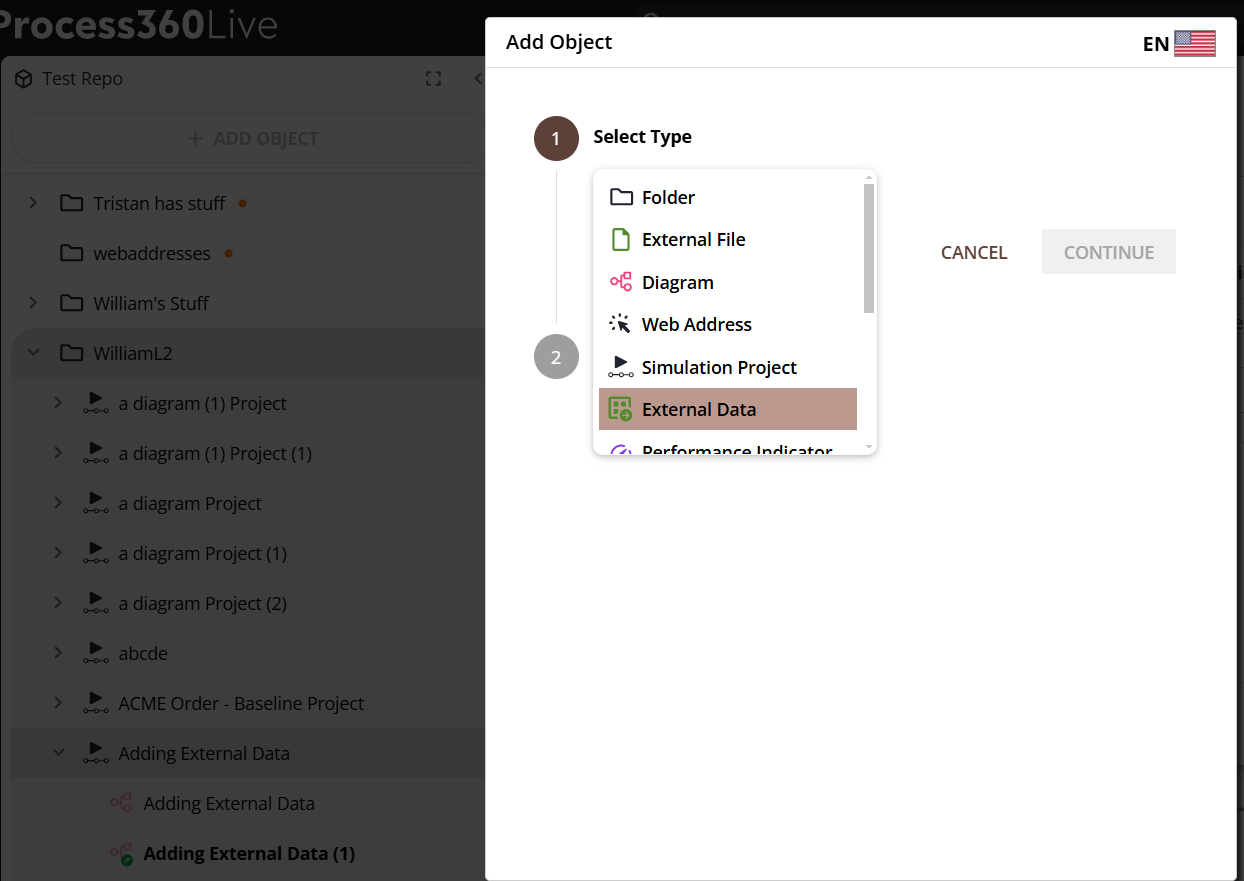
Creating the External Data Object
Add an object of type External Data to the repository (e.g., right-click on a folder , choose Add Child Object, and choose External Data type and click the continue button):
Uploading (Populating) the Initial Data
Click “Upload File” or simply drag-drop a file to add the first data. Note the accepted file types are listed (e.g., XLS/XLSX, CSV, TSV and TXT files):
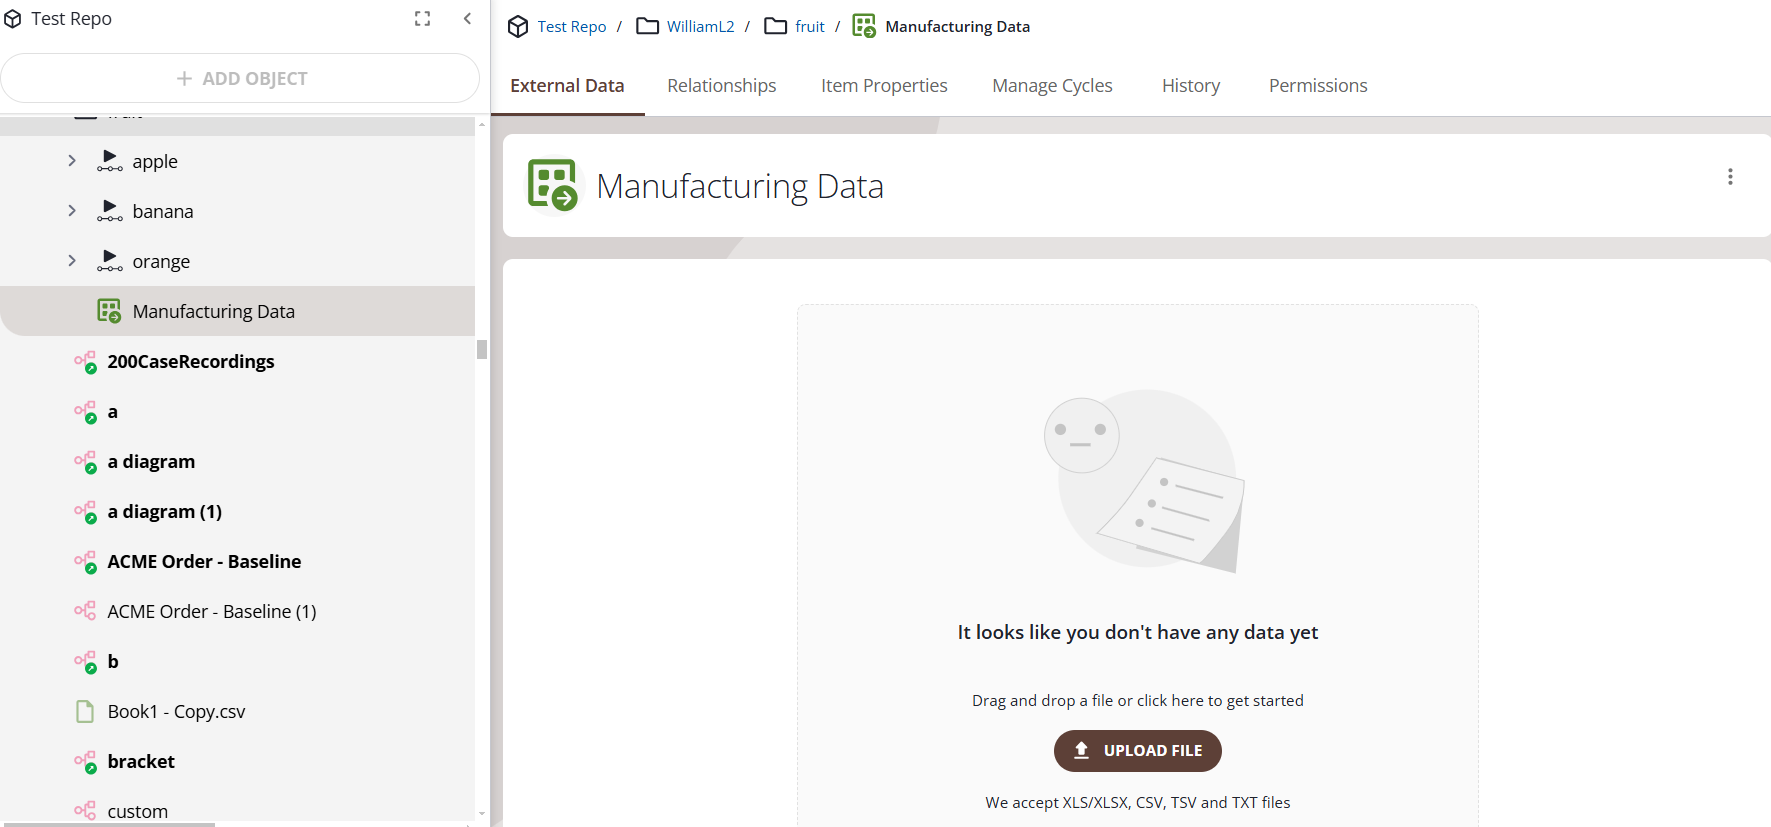
Once some data is uploaded, it will be displayed.
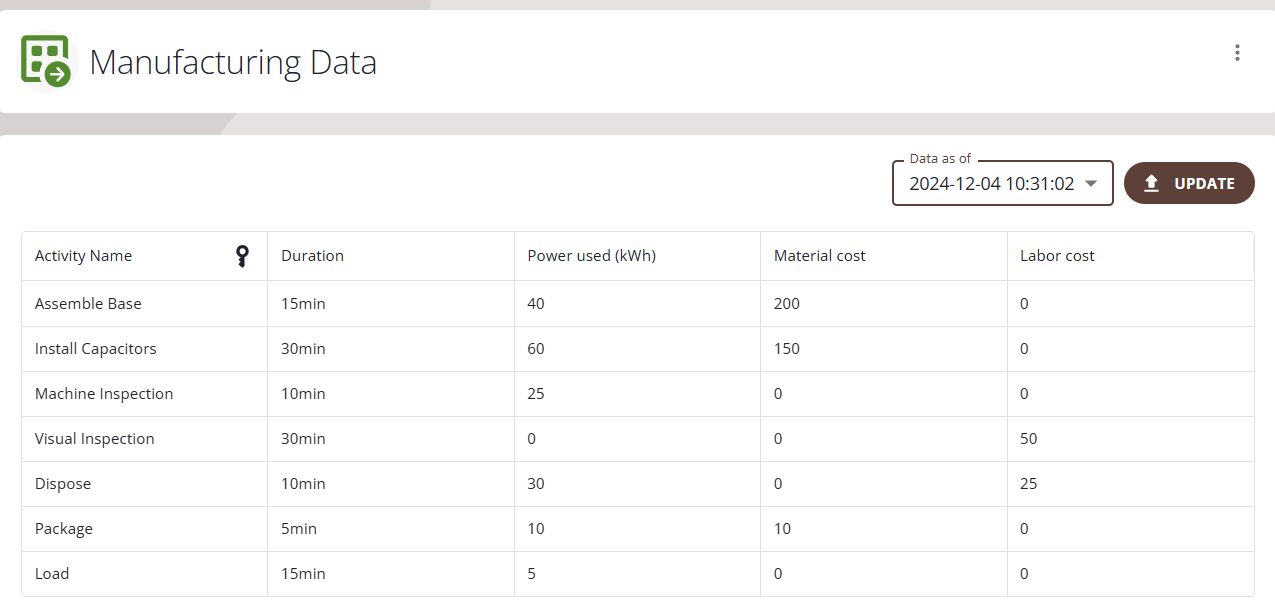
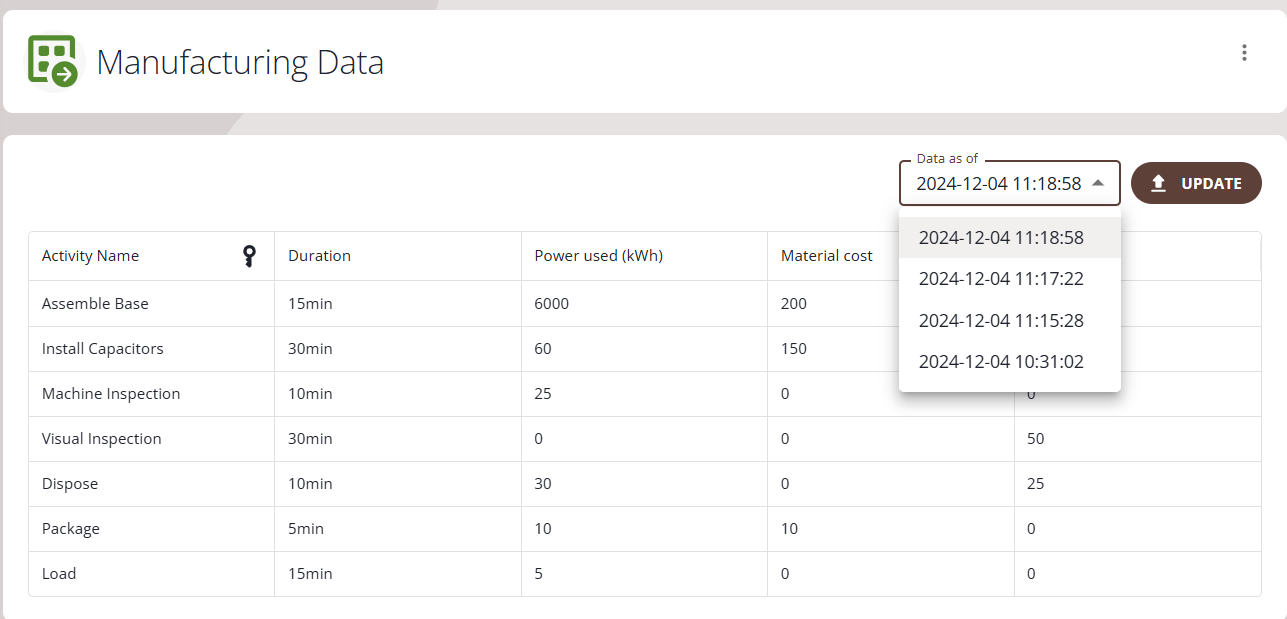
Updating Your External Data
To upload a more recent version of the data, ensure the External Data is selected in the tree / displayed, so you can see the “Update” button. Simply click the “Update” button. The latest version will be displayed. You can see earlier versions by clicking the drop-down menu shown in the ‘Data as of’ field, which shows the date and time the data was uploaded.
Uses for External Data
Anything using this ‘external’ data, such as the External Data Generator, or Diagram Defined Custom Properties , will use the most recent version of the data.
Diagram Defined Custom Properties Data Management
You may add and manage external data to be used by Diagram Defined Custom Properties (DDCP). This allows you to easily update diagram-specific custom data values using external data sources.
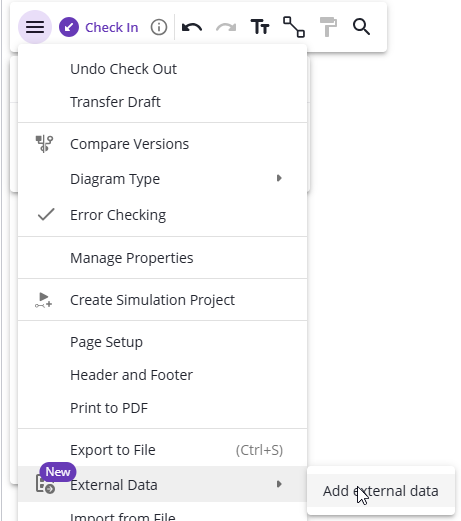
Add External Data to Your Diagram
To add external data to your diagram, go to the File menu, choose ‘External Data’, and then ‘Add external data’
This will start the Add External Data wizard, taking you through steps to add your external data.
You have two options for using External Data in your diagram:
-
Link: This will link to an existing external data object in the repository, keeping the data live and automatically updated with any changes to that file once it is checked in.
-
Upload: This will add data once, without an option to update it later. There is a note on formats of file that are accepted (e.g., XLS/XLSX, CSV, TSV and TXT files).
Link to External Data
If you choose to ‘Link’ to external data (choose the ‘Link’ tab in the wizard), then in summary the steps for using the wizard are as follows:
-
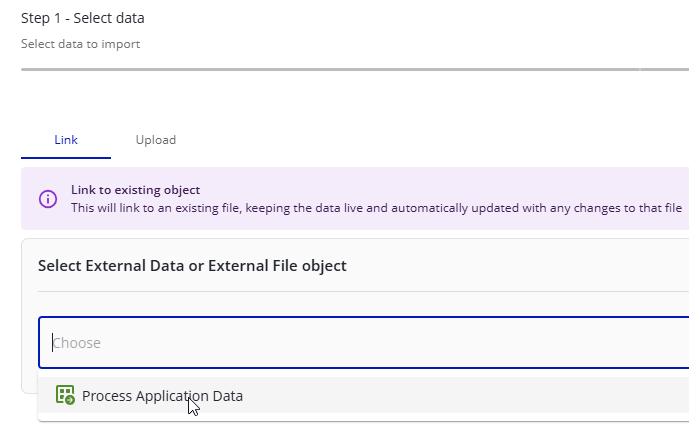
Step 1 - Select Data:
-
Click on the “Select an External Data or External File object” drop-down menu and choose from the existing ‘External Data’ or ‘External File’ objects in the repository that are listed.
-
Click the “Next Step ->” button (in the upper-right corner of the screen).
-
-
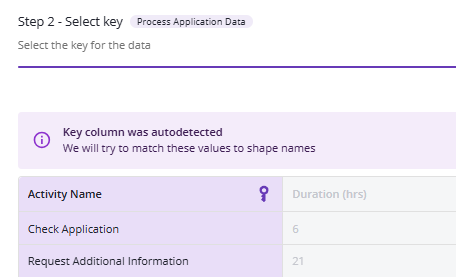
Step 2 - Select Key:
-
You need to select a ‘key’ column; one that contains data that will match with shape labels ('names') in the diagram, so that DDCP values can be supplied to those shapes.
-
A key column may be automatically chosen for you, and you will receive a message like “Key column was autodetected. We will try to match these values to shape names”
-
Click the “Next Step ->” button
-
-
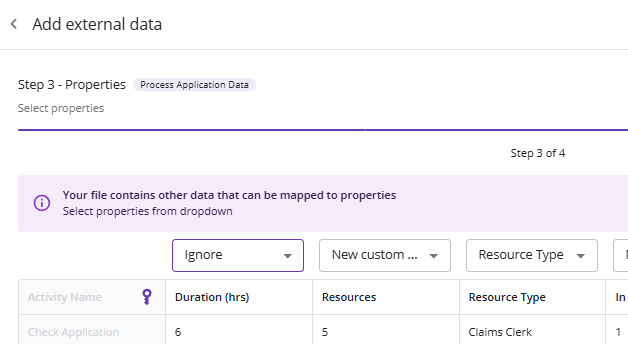
Step 3 - Properties:
-
You may now either map columns of data to existing DDCP’s, create new DDCP’s from the column names, or ignore the data completely.
-
When you are done selecting properties, click the “Next Step ->” button.
-
-
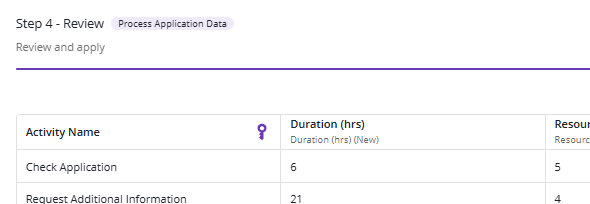
Step 4 - Review:
-
Review your choices about properties to map to, or to create new properties.
-
Once you are done reviewing the data, click the “Finish ->” button.
-
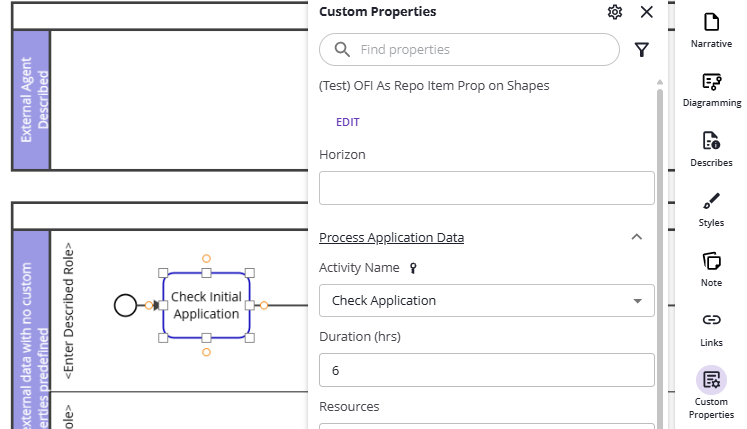
The Custom Properties will be defined if you chose to have them defined (and a message will tell you how many were successfully created), and any rows of data where the value in the ‘key’ column matches a shape name will have values for those custom properties matching each row.
Note: Even if the labels on shapes do not match the key column, you may manually map a particular shape to the set of data associated with the key value, so that all other properties are then associated with that shape:
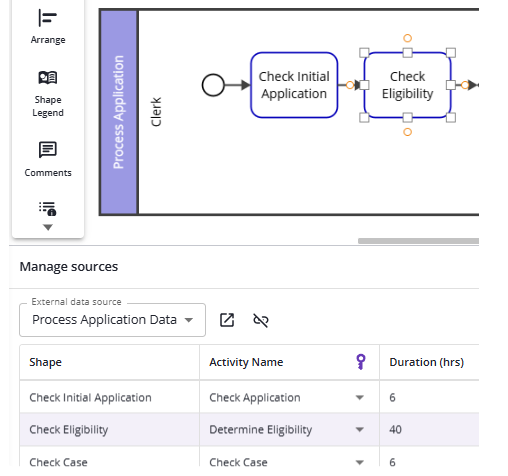
Managing Data Sources
You may manage the source of External Data, and see how values are mapped, by clicking the ‘down arrow’ menu icon next to the Add external data button:
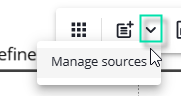
This will display the current data source you’re using, and information about how the data you have imported is mapped to shapes. If you select a shape, the row of data will be highlighted, and vice-versa:
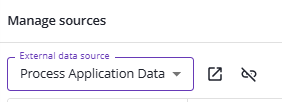
You may choose a different data source, if you have linked more than one data source.
In addition, you may open the external data in a new tab if you have linked to data in the repository, and/or unlink this data from the diagram:
If you unlink data sources, all that data from that source will be removed from the diagram.
Note: If you toggle the Languages Grid on, it will replace the Manage Sources panel. Simply re-display the Manage Sources panel if you would like to see it again.
External Data Generator
To see uses for External Data in the generation of simulation cases (tokens), please see the External Data Generator documentation.