Dashboards provide a place for you to set up at-a-glance views of important status and performance metrics for your enterprise.
View Dashboards
Use one of the following methods to display a dashboard.
To view in the Dashboard area (where dashboards fill the screen):
-
Click the Hamburger icon

-
Click Dashboard
-
From the Dashboard drop-down, choose a dashboard
To view in the Model area (where the repository tree is displayed in the left frame):
-
Expand the Dashboards root folder of the current repository
-
Click the dashboard name you wish to view
-
In the right frame, click the Dashboard tab
Create a Dashboard
To create a new dashboard:
-
Click the Dashboards root folder of the current repository or a child Report Folder name to highlight it
-
Click ADD OBJECT at the top of the repository tree
-
In the Select drop-down, click Dashboard
-
Click CONTINUE
-
Type a Name
-
Under Gadgets and Layout:
-
Choose Empty or
-
Choose Copy From Existing Dashboard. You then have the option to:
-
Type the name of an existing dashboard in the Search field and select it when found
-
Click the Search icon

-
Turn on the Show Tree switch to select a dashboard from the repository Dashboards tree
-
-
-
Set additional options as desired
-
Click FINISH
You can now add gadgets to your new dashboard and, if you copied a dashboard, modify the configuration of copied gadgets.
Add Dashboard Gadgets
In a newly-created dashboard, or at the bottom of an existing one, there are ADD NEW GADGET buttons. Click one of these buttons to add a gadget in the corresponding space. A context menu appears, prompting you to choose one of the following gadget types:
-
Chart – A graphic display of data. See Chart for more information.
-
Table – A tabular display of data. See Table for more information.
-
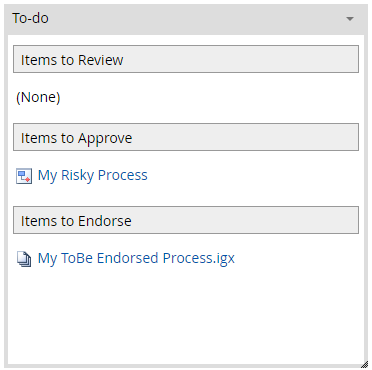
To-do – A list of cycle group action items that you need to complete, including items to review, approve and endorse.
-
IFrame – This gadget lets you bring content from a specific web page into your dashboard by providing the page URL.
-
Rich Text – Place formatted, static text content on your dashboard with this gadget.
-
Performance Tree – A "traffic light" tree display of multiple Performance Indicators. The Performance Indicator Aggregation determines the color of the traffic lights.
-
Custom Object List – A definable list of specific objects or all objects of selected types.
-
List Report - A list of objects and related properties or relationships to other objects.
-
Video - An iFrame gadget that allows for embedding videos via URL.
-
Diagram - An interactive diagram canvas gadget with zoom controls and an Open button to access the diagram area.
-
Quickstart - Add a Create Diagram button and convenient access to any object or folder in your repository.
Example: Add a To-do gadget
To add a To-do gadget:
-
With a Dashboard displayed, click ADD NEW GADGET at the desired location
-
Select To-do from the options presented
-
The Dashboard now displays the To-do List. If a user has items to Review, Approve, or Endorse, they will be displayed, as shown below:
Resize a Gadget
-
Place the cursor over the lower-right corner of the gadget
-
Drag and drop the corner to a new location
Move a Gadget
-
Drag and drop the gadget header to a new location not occupied by an existing gadget