Table objects are tabular displays of Performance Indicator data. Table objects can be displayed in Dashboards like Chart, and also appear in Performance Tree gadgets when created inside a repository folder that is included in a Performance Tree view.
Table objects can be contained by most repository folders and objects except the Risk Catalog. However, to have table data appear in a Dashboard Performance Tree gadget, it must be in a repository sub-folder, and not in the top-level folder.
Add a Table Object
To add a Table:
-
In the repository tree, click a folder or object name (to highlight it) where you want to add the table
-
Click ADD OBJECT at the top of the repository tree
-
In the Select drop-down, choose Table
-
Type a Name
-
Set the Summary, Watch this object, and Create Another fields as desired
-
Click FINISH
-
Follow the steps below to add data to the table
As a best practice, it is recommended that you create Table Objects in the same folder where their component Performance Indicators reside. That's not a requirement for them to function correctly, but makes it possible to include them in Performance Tree gadget views in the Dashboard.
Editing Table Object Data
Edit Table contents by choosing the "Table" tab, click EDIT TABLE, and follow the steps below:
Add Performance Indicators to a Table Object
After you create a Table Object, the next step is to populate it with Performance Indicator data. If you have not yet defined the Performance Indicators, do so as described in Adding a Performance Indicator.
To add Performance Indicator data to a Table:
- In the repository tree, click the name of the Table (to highlight it) you wish to add data to
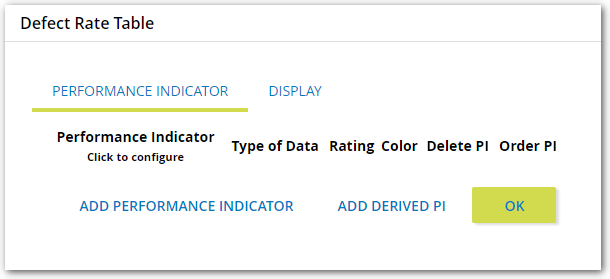
- In the right frame, click the EDIT TABLE. A dialog box appears, with the name of the Table object at the top. This dialog box lets you add Performance Indicators and derived values to the Table object, delete them, or re-order their position in the table. The first time you use it, for a new Table object, it appears as shown. This example Table is named "Defect Rate Table", you will specify your own Table name.
- Click the Add Performance Indicator button to display the Choose Objects dialog. You then have the option to:
- Type a Performance Indicator name in the Search field and select it when found
- Click the Show Tree switch, expand folders, and select a Performance Indicator
- When done selecting desired Performance Indicators, click CONFIRM SELECTION.
- The Performance Indicators you selected are added to the dialog box, as shown:
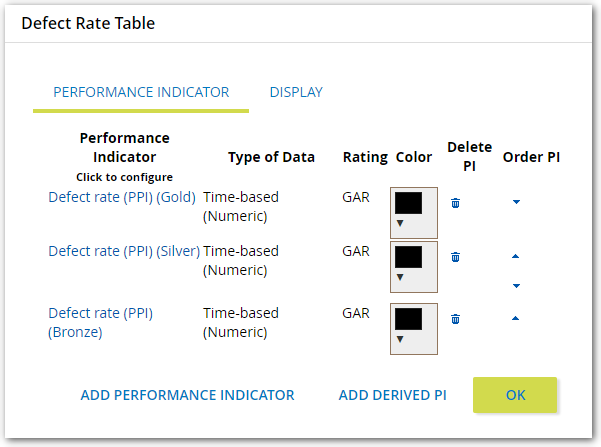
- In addition, the Performance Indicators have already been added to the Table object so clicking OK (or clicking outside the dialog ) returns you to the object display with the added data
Add Derived Performance Indicators
Derived Performance Indicators are created by performing a statistical operation (Sum, Average, Max, Min, or Median) on the data from the PIs in the Table object. A derived Performance Indicator will use the values of the other Performance Indicators having the same date or category and perform the specified operation on the related data points.
To add derived Performance Indicator data to a Table object, do the following:
- In the repository tree, locate and click the Table object to highlight it.
- Click the Edit Table button. A dialog box appears, with the name of the Table object at the top.
- Click the Add Derived PI button. The Add Derived Performance Indicator dialog box appears, as shown:

- Type a name for this derived PI in the Name of derived Performance Indicator box.
- Select an operation from the drop-down list of options: Sum, Average, Max, Min, or Median. Then, click ADD DERIVED PERFORMANCE INDICATOR. The Derived PI you created appears at the bottom of the list in the Edit Table Object dialog box, as shown.
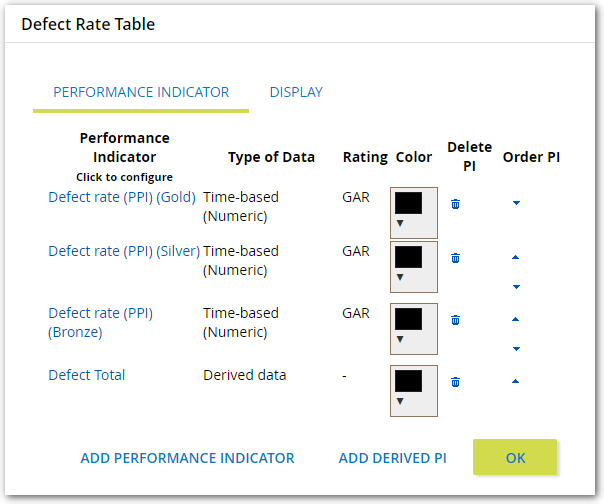
- In the Performance Indicator column, you can click a link for each component Performance Indicator or Derived PI to access additional configuration tabs that affect how its data is calculated and displayed. For more information on configuring Performance Indicators for Table Objects, see Configure Performance Indicators in a Table Object.
- The Type of Data column displays the type of data reported by the Performance Indicator.
- The Rating column displays the type of rating system color scheme set for each PI: RAG, GAR, RAGAR, RG, GR, or a hyphen for PIs with no rating system set or for Derived PIs, which do not have a rating system.
- The Color column lets you set a background color for each PI's column in the table.
- Close the Edit Table Object dialog box by clicking OK or clicking just outside the dialog box. Your Table Object should now be populated with the derived Performance Indicator data you set up.
Configure Performance Indicators in a Table Object
You can configure the data from the component Performance Indicators in a Table Object to
- Make it align better with data from other Performance Indicators
- Have it best fit the intended purpose of the Table object
- Highlight specific aspects of the information it represents
Many of these configuration settings pass on values that must be configured for the source Performance Indicator. See Adding a Performance Indicator for information on setting up source Performance Indicators.
To configure Performance Indicator data in a Table object, do the following:
- In the repository tree, locate and click the Table object.
- Click the Edit Table button. A dialog box appears, with the name of the Table Object at the top. If necessary, click the Performance Indicator tab to display its contents.
- In the Performance Indicator column on the left of the tab, click the link for the Performance Indicator you want to configure. The dialog box displays a new page, labeled Configure Performance Indicator "name", with four tabs: Display, Limits, Target, and Trend.
- Configure the Performance Indicator as needed, using the following tabs and settings:
- The Display tab settings affect the way the data is displayed in the Table Object.
-
The Date grouping drop-down list lets you group Performance Indicator data entries in the Table Object into Daily, Weekly, Monthly, or Yearly averages. The default setting, None, reports the data as it appears in the source Performance Indicator.
Note that the value of this setting applies to all Performance Indicators in the Table object
- The Value grouping drop-down list
- The Rounding drop-down list
- The Rollup type drop-down list lets you add a calculated rollup value at the bottom of the data column to summarize it. Available rollup types are Sum, Average, Max, Min, and Median. The default value is None.
- The Display Performance Indicator check box lets you hide a Performance Indicator's data in the Table Object without removing it. To hide the column of data for this PI, uncheck the box.
- The Custom display name setting lets you substitute a custom name for this PI data in its table column header. To use a custom display name, check the check box and type a custom name in the text box under it.
- The Unit in header check box, when selected, places the Units setting for the source Performance Indicator in parentheses to the right of its name or custom display name in the table column header. If this check box is selected and there is no Units value specified for the source PI, you'll see empty parentheses in the header.
- The Text align drop-down list lets you change the alignment of the data in its table column. to Left, Center, or Right. The default setting is Left.
- The Column header align drop-down list lets you change the alignment of the table column header for this Performance Indicator data to Left, Center, or Right. The default setting is Left.
-
- Limits tab
- The Show limits check box on the Limits tab adds a traffic light indicator for each data value displayed from this Performance Indicator, based on the limits set for it. If no limit is set for the PI, the indicator color is gray.
- Target tab
- The Show target check box on the Target tab displays SOMETHING for each data value displayed from this performance Indicator, to indicate whether it is above or below the target value set for the source Performance Indicator.
- Trend tab
- The Show trend check box on the Trend tab adds a trend indicator for each data value displayed from this Performance Indicator. For upward trends, a green arrow pointing up is displayed; for downward trends, a red arrow pointing down; for flat trends, a gray circle.
- The Display tab settings affect the way the data is displayed in the Table Object.
- Repeat steps 3 and 4 for any additional Performance Indicators in the Table object that you want to configure.
- Close the Edit Table Object dialog box by clicking OK or clicking outside the dialog box. The Performance Indicator columns in the Table Object should now be displayed as you configured them to be.
Modifying the Appearance of a Table Object
Once you have added Performance Indicators to your Table object, you can change they way Performance Indicator data is displayed in the table, as follows:
- In the repository tree, locate and click the Table name to highlight it.
- If necessary, in the right frame, click the TABLE tab. This tab shows the current data in the table, if any is present.
- Click the EDIT TABLE button. The Edit Table Object dialog box appears.
Note: Your changes to the settings in this dialog box are made instantly; there is no need to save them.
- On the Performance Indicator tab, you can configure the individual Performance Indicators to provide the most useful data for this Table Object.
- In the Performance Indicator column, you can click a link for each component Performance Indicator or Derived PI to access additional configuration tabs that affect how its data is calculated and displayed. For more information on configuring Performance Indicators for Table Objects, see Configure Performance Indicators in a Table Object.
- The Type of Data column displays the type of data reported by the Performance Indicator.
- The Rating column displays the type of rating system color scheme for each Performance Indicator: RAG, GAR, RAGAR, RG, GR, or a hyphen for Performance Indicators with no rating system set or for Derived Performance Indicators, which do not have a rating system.
- The Color column lets you set a background color for each Performance Indicator column in the table.
Since the color options for Table Object columns are background colors, the predefined options are less-saturated (lighter) colors. Picking lighter colors will make your table data more visible.
- The Delete PI column contains a trash can icon for each component Performance Indicator. Clicking one of these deletes the related Performance Indicator.
- The Order PI column contains arrow icons you can click to change the order of the Performance Indicators in the table.
- On the Display tab, you can specify the following settings related to table content and formatting:
- The Row header align drop-down list lets you specify how the timestamp data is aligned in the Date column. The default value is Left.
- The Rollup name value appears in the left column of the row of Rollup values, if any, configured for the Performance Indicators in the Table Object. See Configure Performance Indicators in a Table Object for information on configuring Rollup types.
- To limit the Performance Indicator data displayed in the table, set a duration for the Show data up to the last settings. When changed from the default value of "All data," you can specify a duration of Years, Months, Weeks, Days or Hours, and set a number of those increments in the box on the left.
- The Background color picker on this tab specifies a background color for the leftmost Date column of the table.
- The Auto Refresh setting lets you set an interval for refreshing the PI data in the table, in increments of 5 seconds, 30 seconds, 1 minute, 5 minutes or 15 minutes. The default value is No, which means that auto-refreshing is disabled.
- On the Performance Indicator tab, you can configure the individual Performance Indicators to provide the most useful data for this Table Object.