The iGrafx Platform provides charting capabilities for Performance Indicators using time-based, category-based, and rollup data.
Performance Indicator charts can be customized to allow a wide range of display options for visualizing your Performance Indicator data.
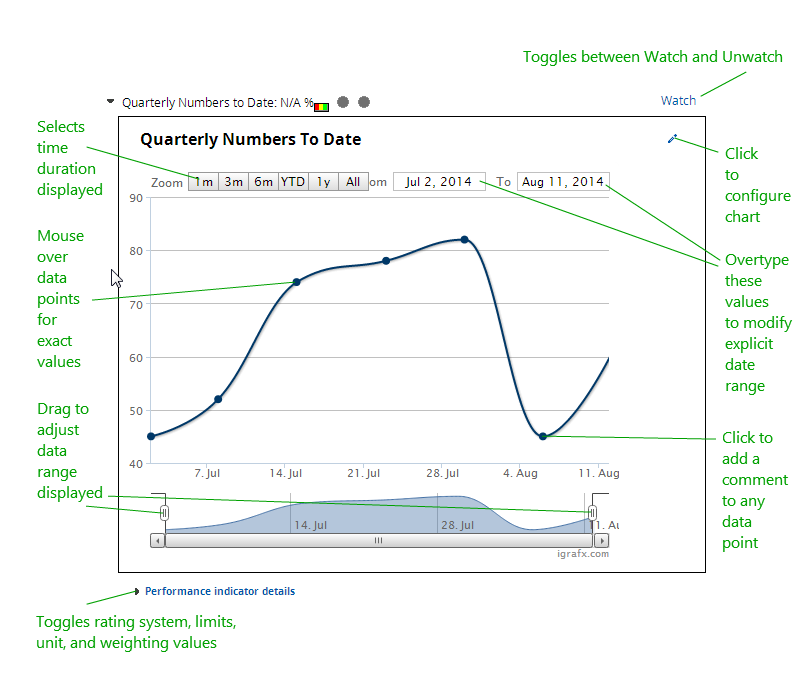
See the following sample chart for a quick guide to some of the chart functionality.