Description
This page discusses the Value Stream Mapping (VSM) feature on the web diagram.
A Designer, or Architect license is required to create and edit Value Stream Map web diagrams (or equivalent User Extensions ).
You can now create a new diagram type called Value Stream Map (VSM). This will allow you to diagram every step needed to bring a product from order to delivery, including the material and information flows. This is used in continuous improvement to identify and eliminate waste.
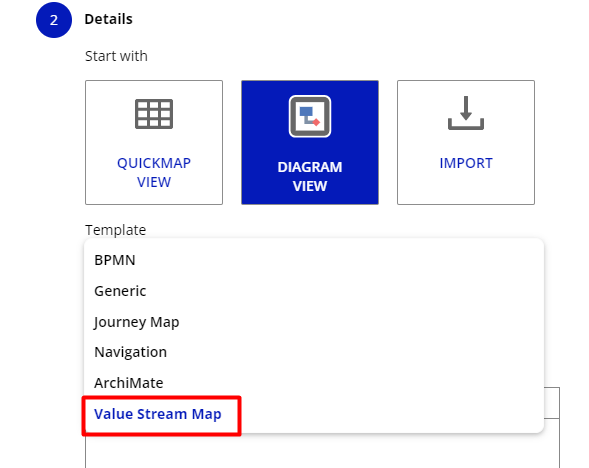
Creating a new VSM diagram
-
From a web diagram folder or Repository root
-
Click the Add object button
-
Set the Select type dropdown to Diagram
-
Make sure Diagram View tile is selected (if not select that tile)
-
Under template change the dropdown to Value Stream Map
-
Add a name
-
Fill out any other required fields and click Finish
Changing diagram type to VSM
Diagram type can be changed by clicking File → Diagram Type → Value Stream Map
-
If Diagram doesn't have any Diagram Defined Custom Properties created, it will auto create the default ones for VSM
-
Will enable the timeline as long as it wasn't previously disabled
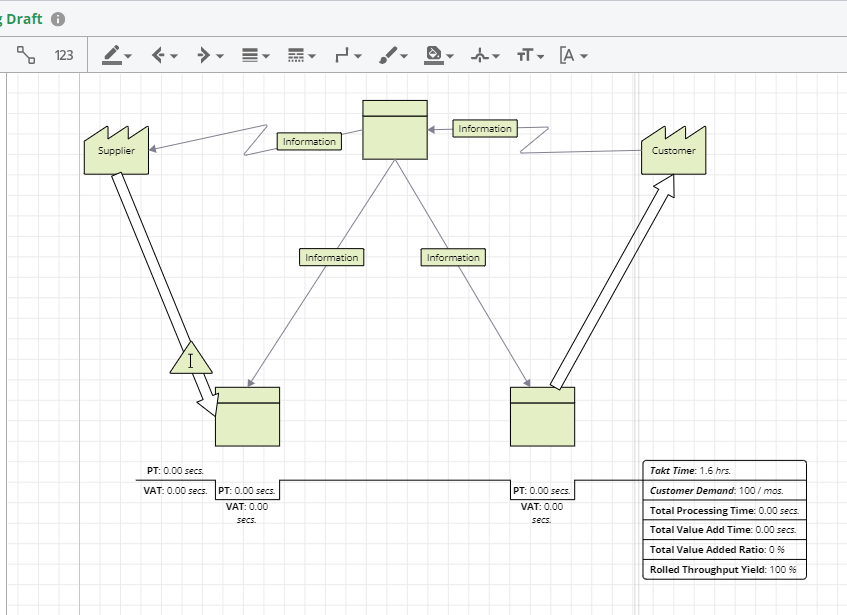
Default state of VSM diagrams
-
A List of pre-defined Diagram Defined Custom Properties for VSM
-
Availability %
-
Changeover Time
-
Defect %
-
Inventory Amount
-
None-value add Time
-
Operators
-
Percent Complete And Accurate
-
Pieces
-
Processing Time
-
Uptime %
-
Value Add Time
-
-
VSM All Shape library selected
-
Timeline enabled by default
-
Metrics panel enabled by default
-
lists all predefined properties
-
-
Basic built-in template diagram (No template diagram was added to the repository)
-
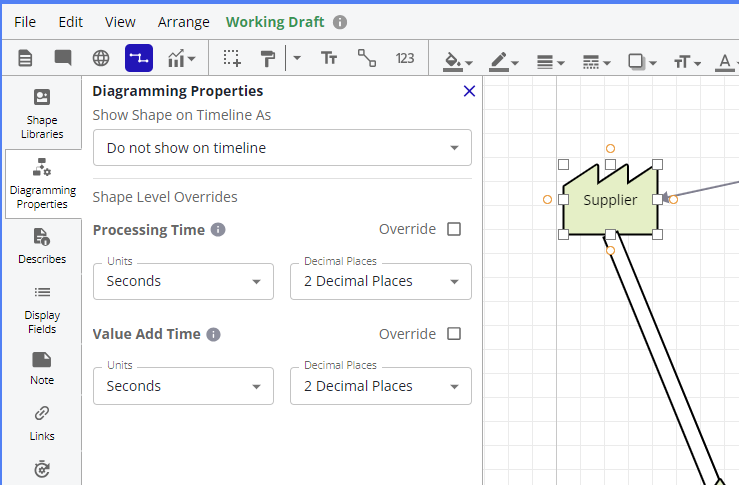
Diagramming properties
Configuration options for either shapes or the timeline (depending on diagram selection)
Shape
-
Shape visibility control (Used to configure if a shape (or shapes) should show on a timeline (and how) or not show on timeline)
-
Show as Activity
-
Show as Inventory
-
Do not show on timeline
-
-
Shape timeline overrides (If override is enabled for the property, it will use the settings from the shape instead of at the diagram level for just that entry on the timeline. It will not affect other entries on the timeline.)
-
Processing Time
-
Override not enabled by default
-
Units: seconds
-
Decimal Places: 2
-
-
Value Added Time
-
Override not enabled by default
-
Units: seconds
-
Decimal Places: 2
-
-
Diagram
-
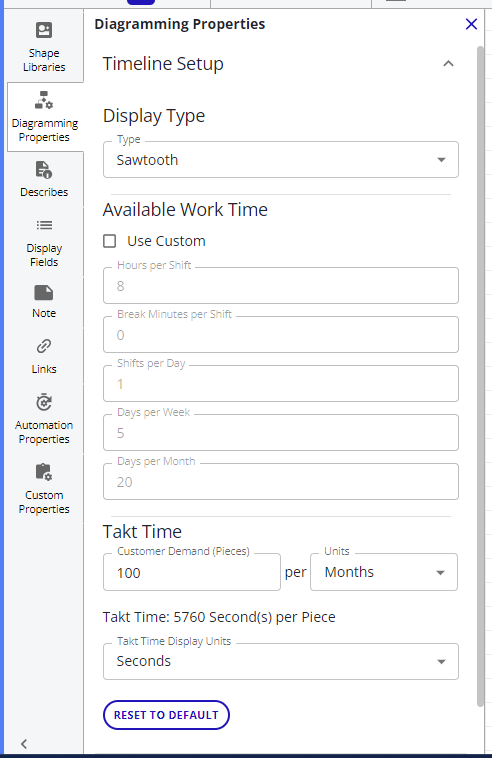
Timeline Setup - Controls setup of values such as available worktime, customer demand and takt time.
-
customer demand
-
defaults to 100 pieces per month
-
-
Takt time
-
defaults to 5760 seconds per piece
-
-
-
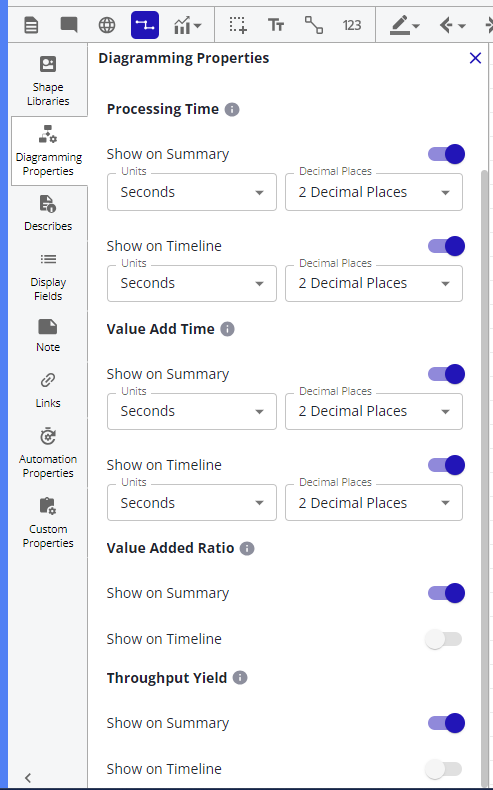
Timeline properties - Controls which properties show up on the timeline and or summary box. A limit of 2 properties can be enabled on the timeline
-
Processing Time
-
Enabled by default on timeline and summary box
-
Units: seconds
-
Decimal Places: 2
-
-
Value Added Time
-
Enabled by default on timeline and summary box
-
Units: seconds
-
Decimal Places: 2
-
-
Value Added Ratio
-
Enabled by default in the summary box
-
-
Throughput Yield
-
Enabled by default in the summary box
-
-
"Auto" Units
For both the diagram and shape level diagramming properties, the Processing Time and Total Value Add Time unit selections have an "auto" option, in addition to the normal range of milliseconds through years.
This auto mode will determine the best unit to use to display the value comfortably, using the largest units that result in a value above 1.
VSM shape libraries
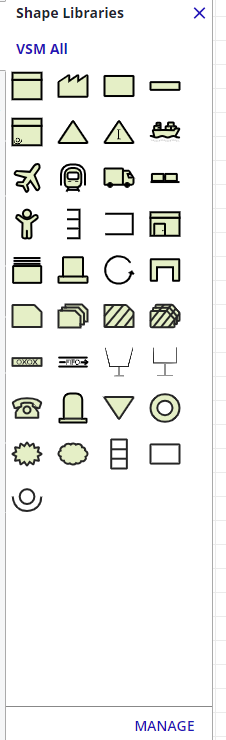
There are 4 libraries for VSM
-
VSM All
-
VSM General Icons
-
VSM Information Flow
-
VSM Material Flow
Default shape properties
-
Default to Show as Activity
-
Process
-
Process with Operator
-
Outside Sources
-
-
Default to Show as Inventory
-
Inventory
-
Inventory 2
-
Supermarket
-
Single Supermarket
-
Buffer
-
Single Buffer
-
Databox
The databox for VSM shapes have been replaced with the Metrics panel (Process Metrics#Metrics-panel).
Adding VSM Data
Add VSM data by selecting a shape, opening the Custom Properties Panel, and adding values to the appropriate properties.
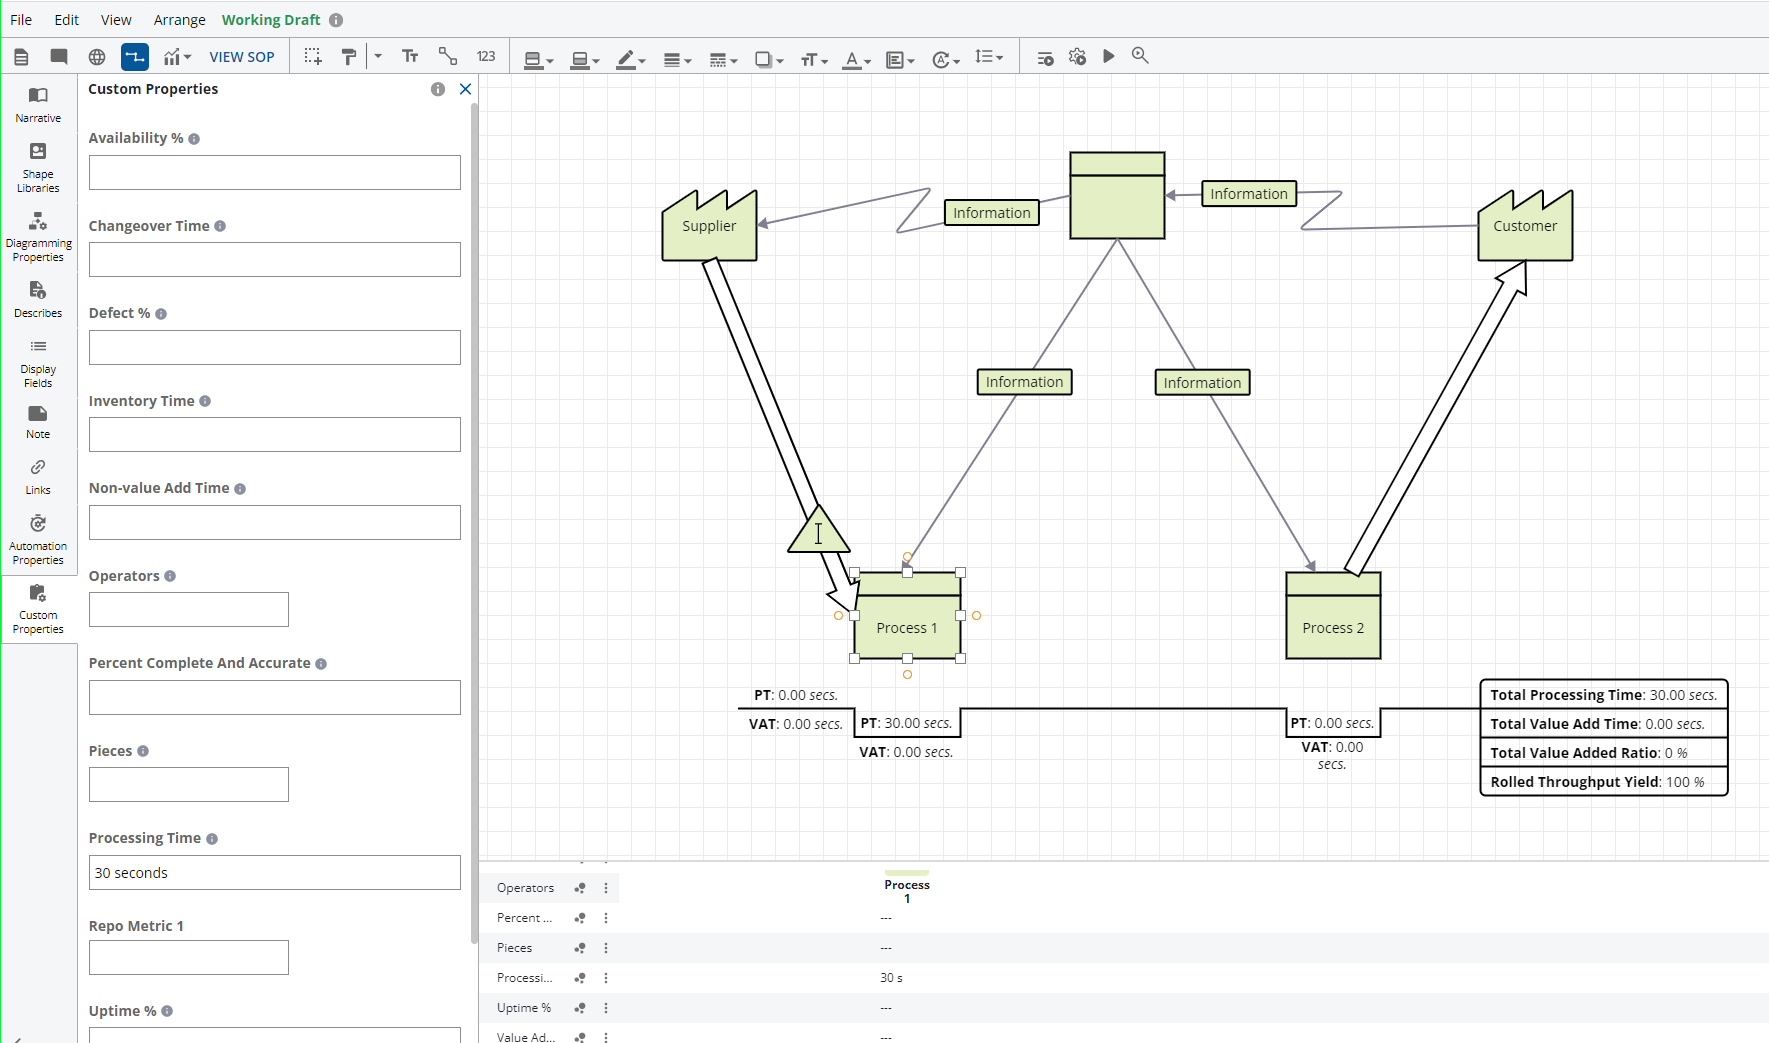
In the example above, Process 1 was selected, the custom properties panel was opened, and 30 seconds was entered into the Processing Time.
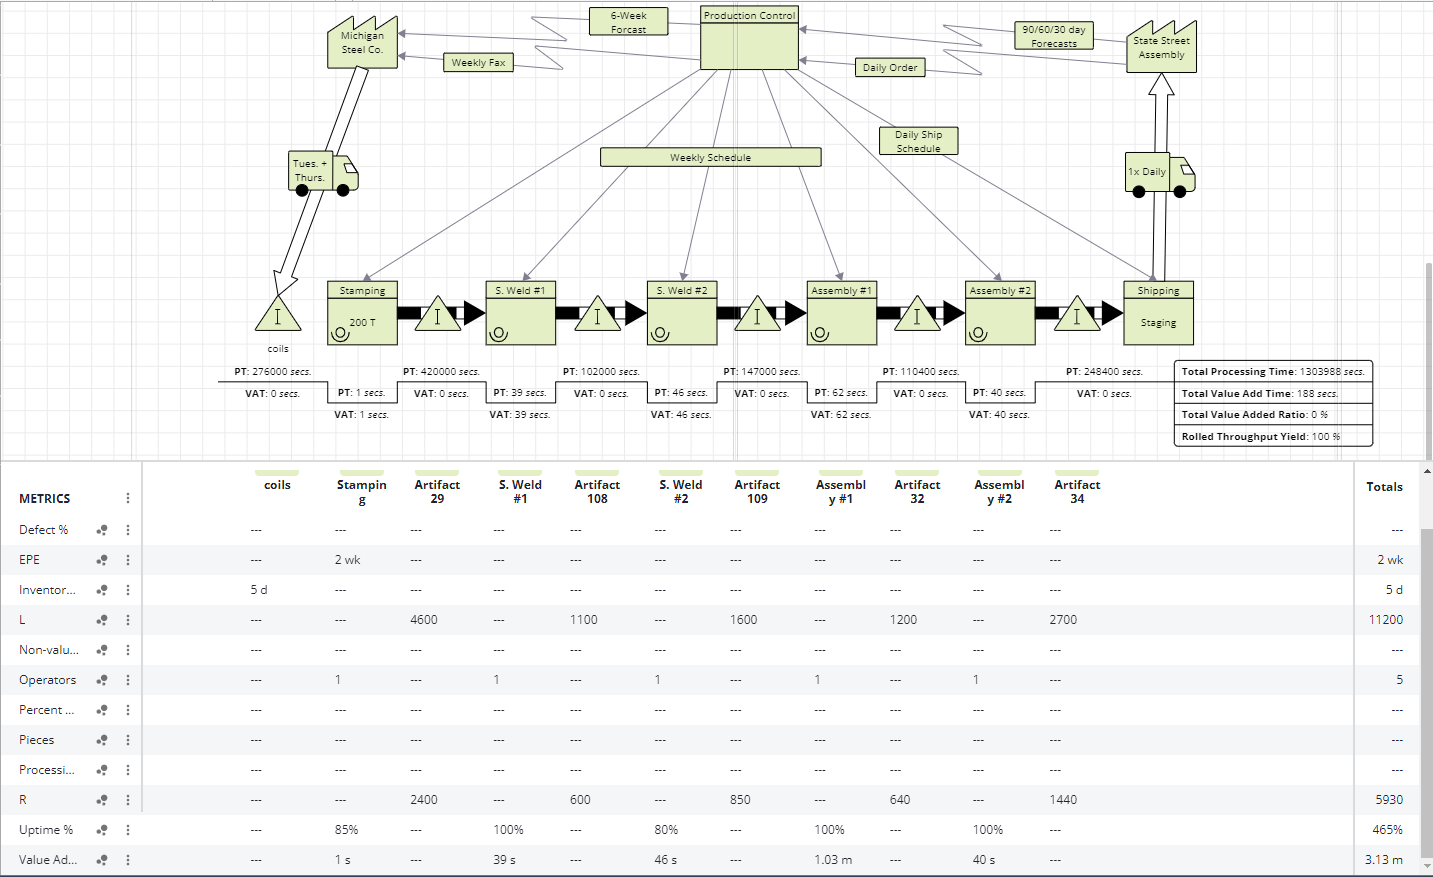
Timeline
What is shown on the timeline is configured by the Diagramming properties panel (see diagramming properties section).
The timeline is adjusted automatically and does not support manual adjustment. The valleys will be inserted into the timeline when there is a shape above the timeline that is set to show as activity. Inventories will show up below as long as there isn't an overlapping activity. It was either go on the left or right side depending on positioning. Overlapping shapes of the shape type will not show up repeatedly on the timeline. Instead the shape with the greater values will be selected if it has a processing time. Otherwise it will use the first shape it finds for that location.
Diagram Defined Custom Properties must be used and the appropriate "Lean Value Type" selected during the creation of the Diagram Defined Custom Property to display values on the timeline.
Note: If values are not showing up on the timeline despite having added values on the shape in the Custom Properties tab, check to make sure the property has the appropriate Lean Type specified. Custom Properties defined at the repository level (Repository Configuration → Custom Properties) do not currently support lean types. Diagram Defined Custom Properties are required to set a Lean Type.
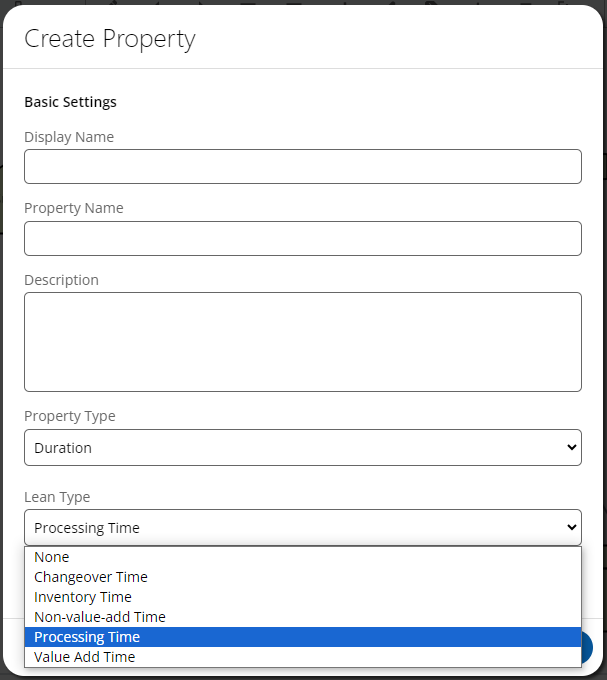
Different Property Types have different applicable Lean Types available.
Glossary & Calculations
See VSM glossary of terms for definitions and how they are calculated.
Simulation
New VSM diagrams created after (19.16.0) support simulation. Copying and pasting older diagram contents will not work. Shapes will have to be created using the existing shape libraries.
The following shapes are treated as shapes by simulation:
-
process
-
facility
-
information
-
control
-
warehouse
-
cross-dock
-
supermarket
-
buffer
-
safety
-
kanban
-
fifo
-
load leveling
Note: The following aren't currently supported for VSM:
-
Reporting
-
Narrative
-
Custom Properties (defined at the repository level under Repository Configuration → Custom Properties) displaying on the timeline
-
VSM shapes don't support changes to line color, dash, or width
-
IGX files does not import VSM diagram properties