Summary
This page discusses the Process Metrics feature and how to use it. It will guide you through importing metric data, attaching them to elements of your diagram, and using the Metrics Overlay feature to analyze your diagram metrics - all within the context of your diagram.
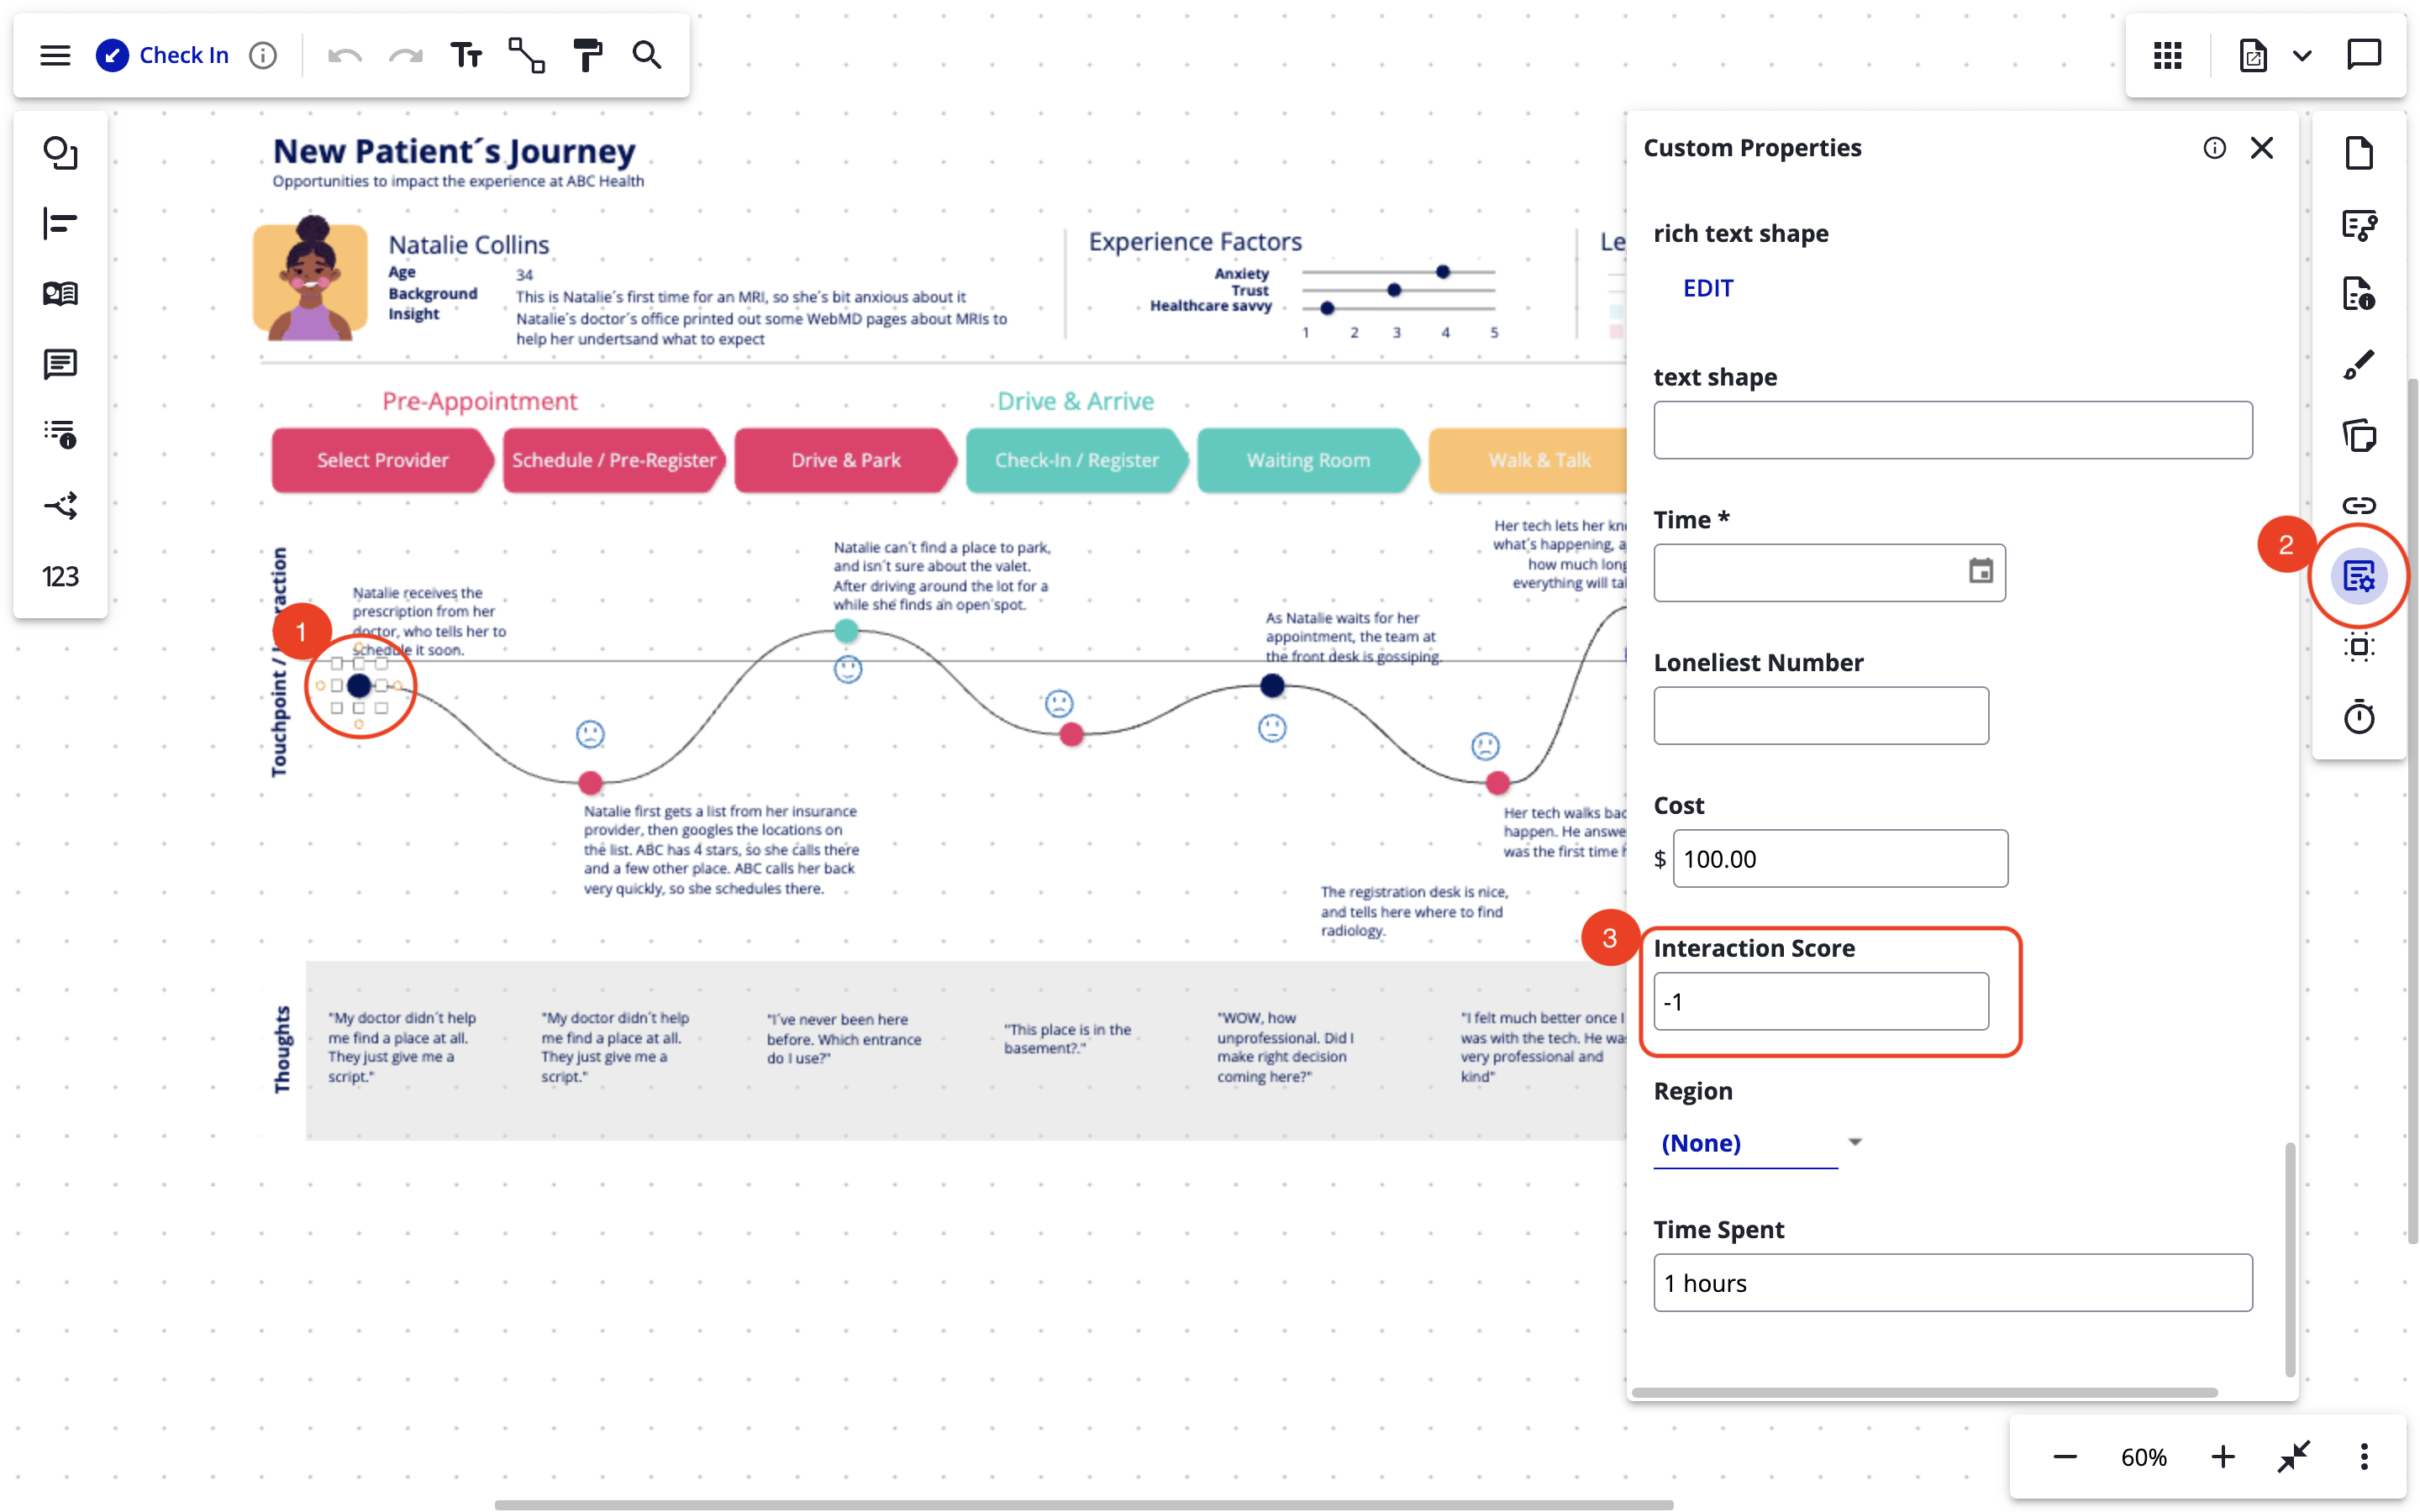
Import data from custom properties
In order to start using metrics with custom properties you must first create either Repository Defined Custom Properties or Diagram Defined Custom Properties. Once you have defined custom properties for your diagram or repository you must then add some custom property values to your diagram.
-
Select a shape
-
You can skip this step to add a value to the diagram itself.
-
-
Open the "Custom Properties" sidebar page.
-
Locate the property in the open Custom Properties menu and enter a value.
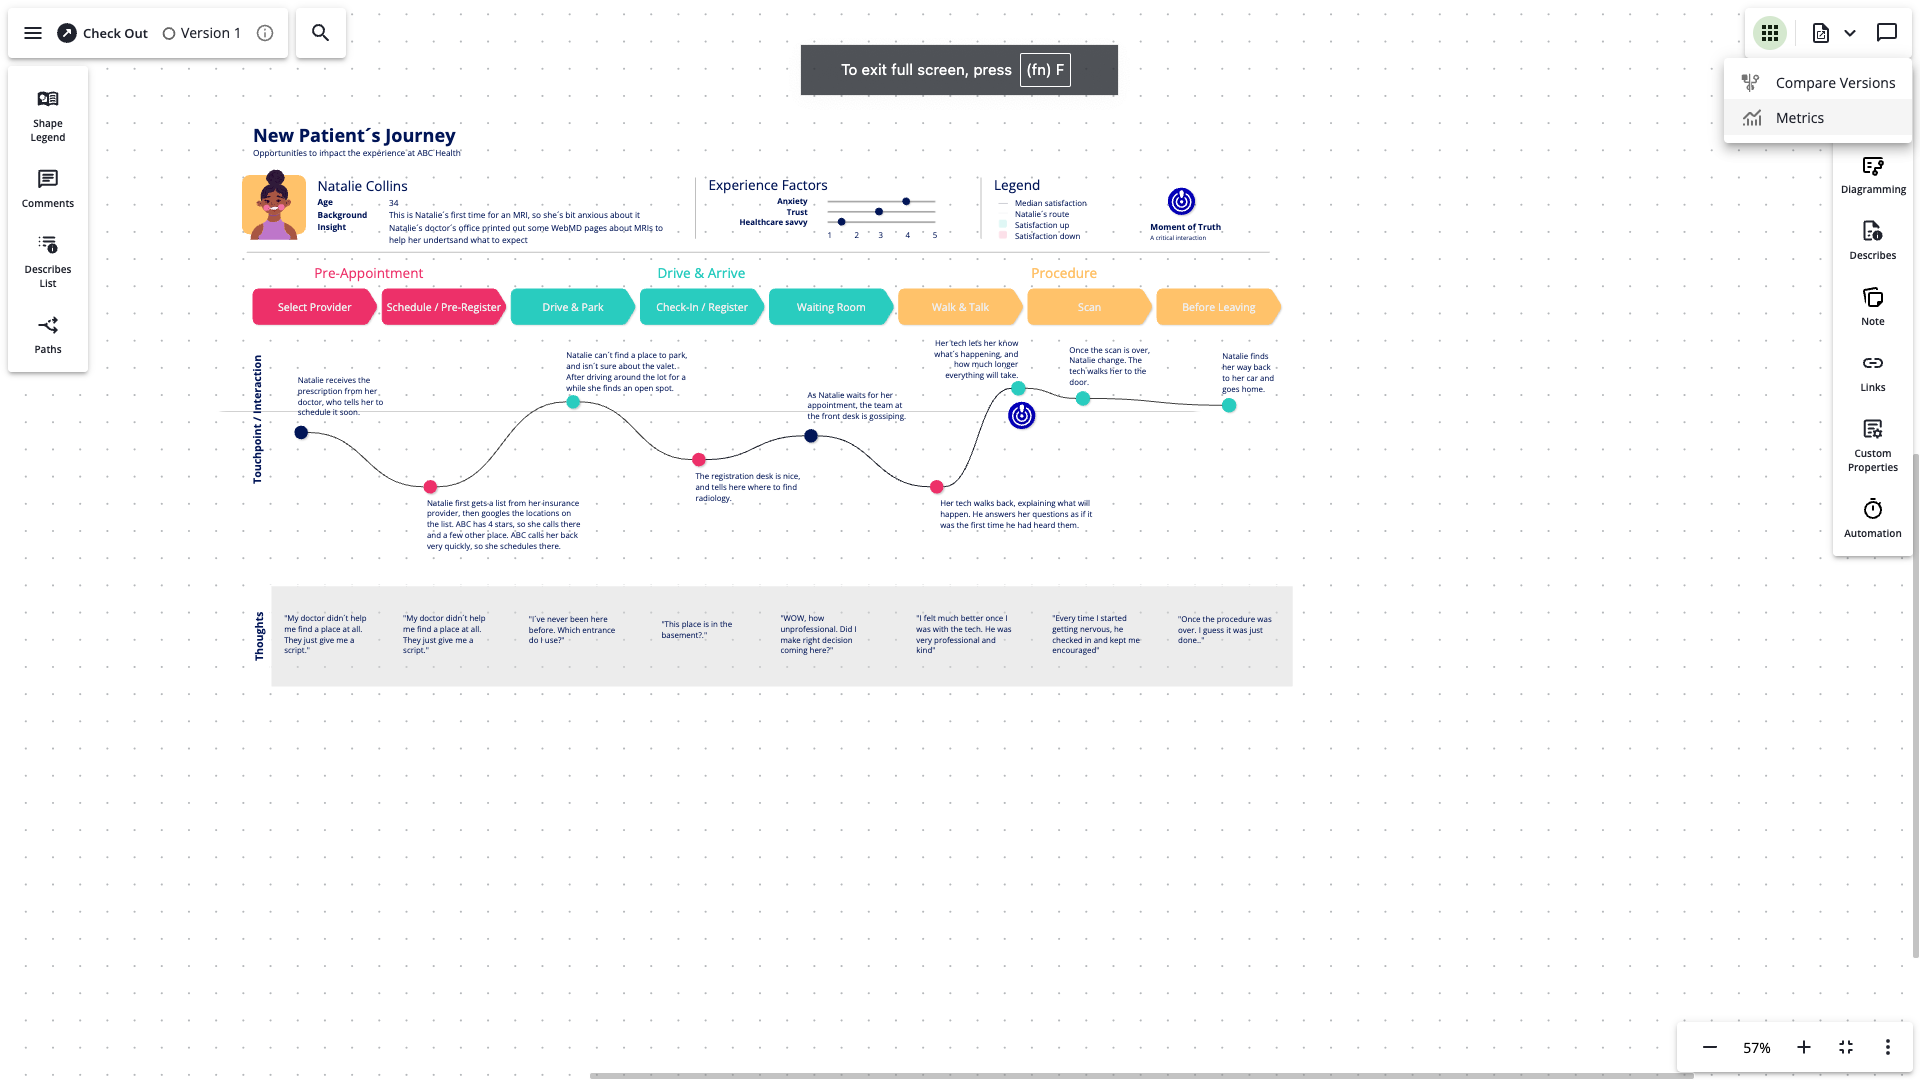
Enable metrics
-
Click the Apps button in the top right toolbar.
-
Click Metrics in the menu.
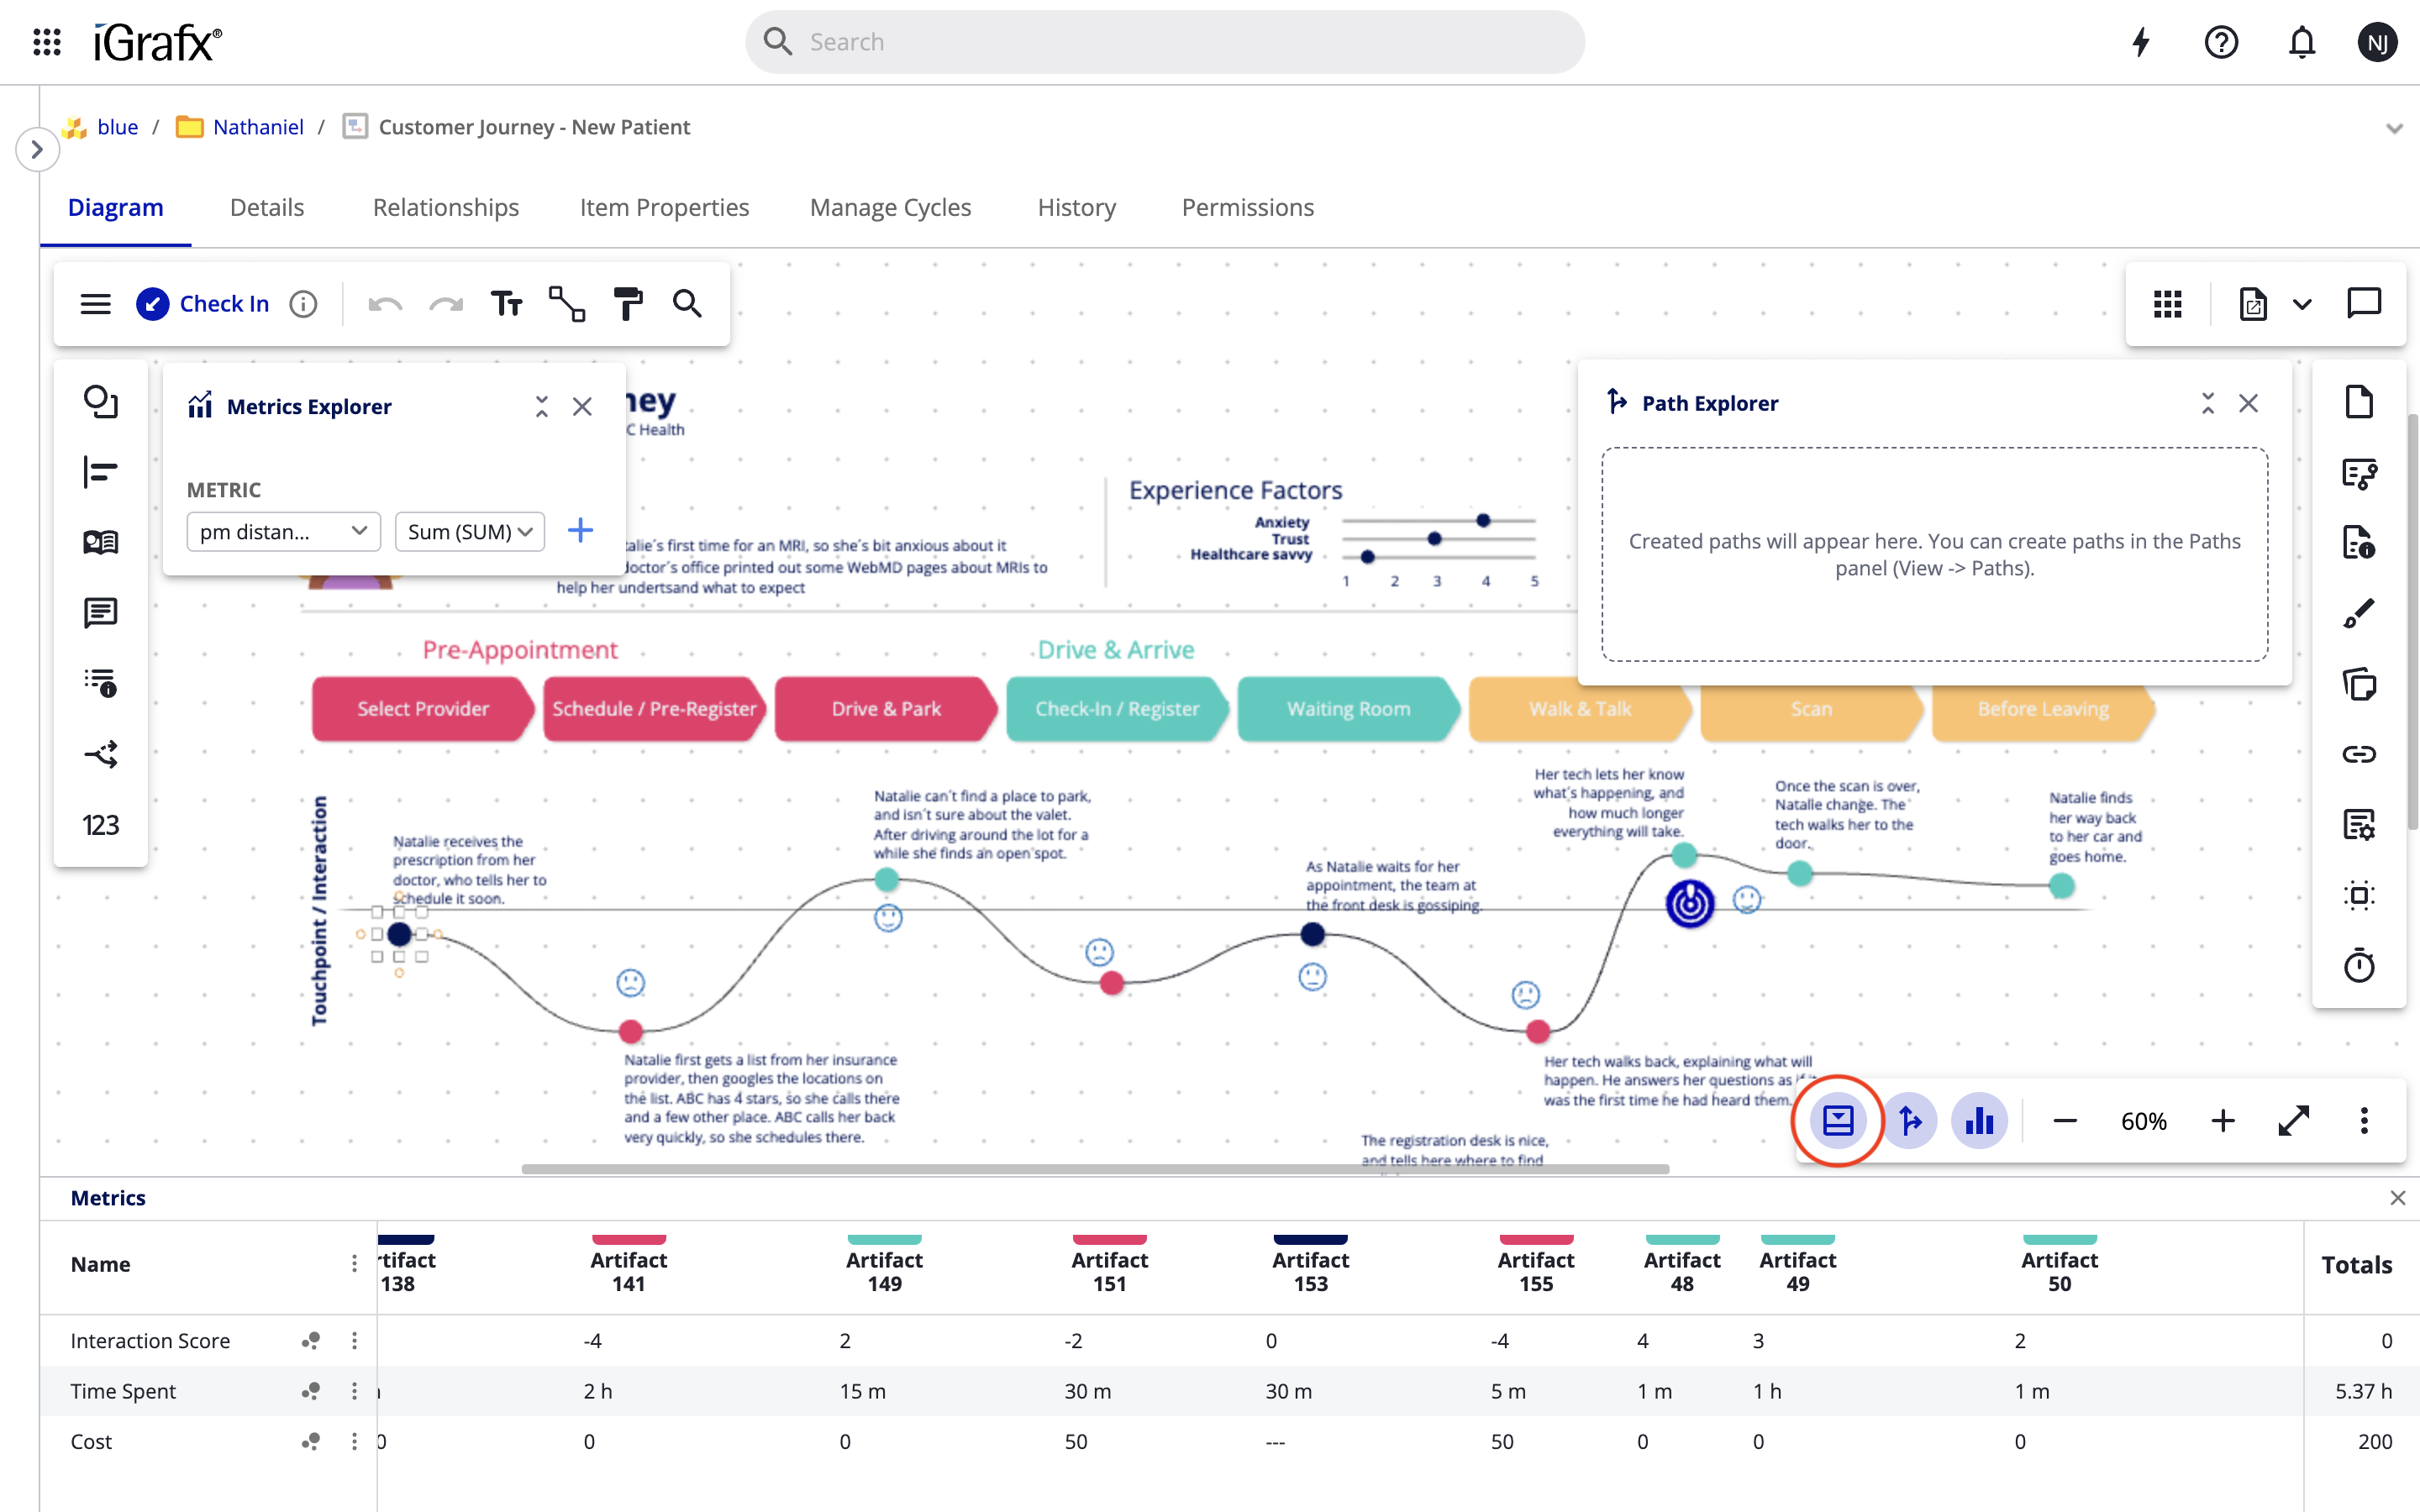
Metrics panel
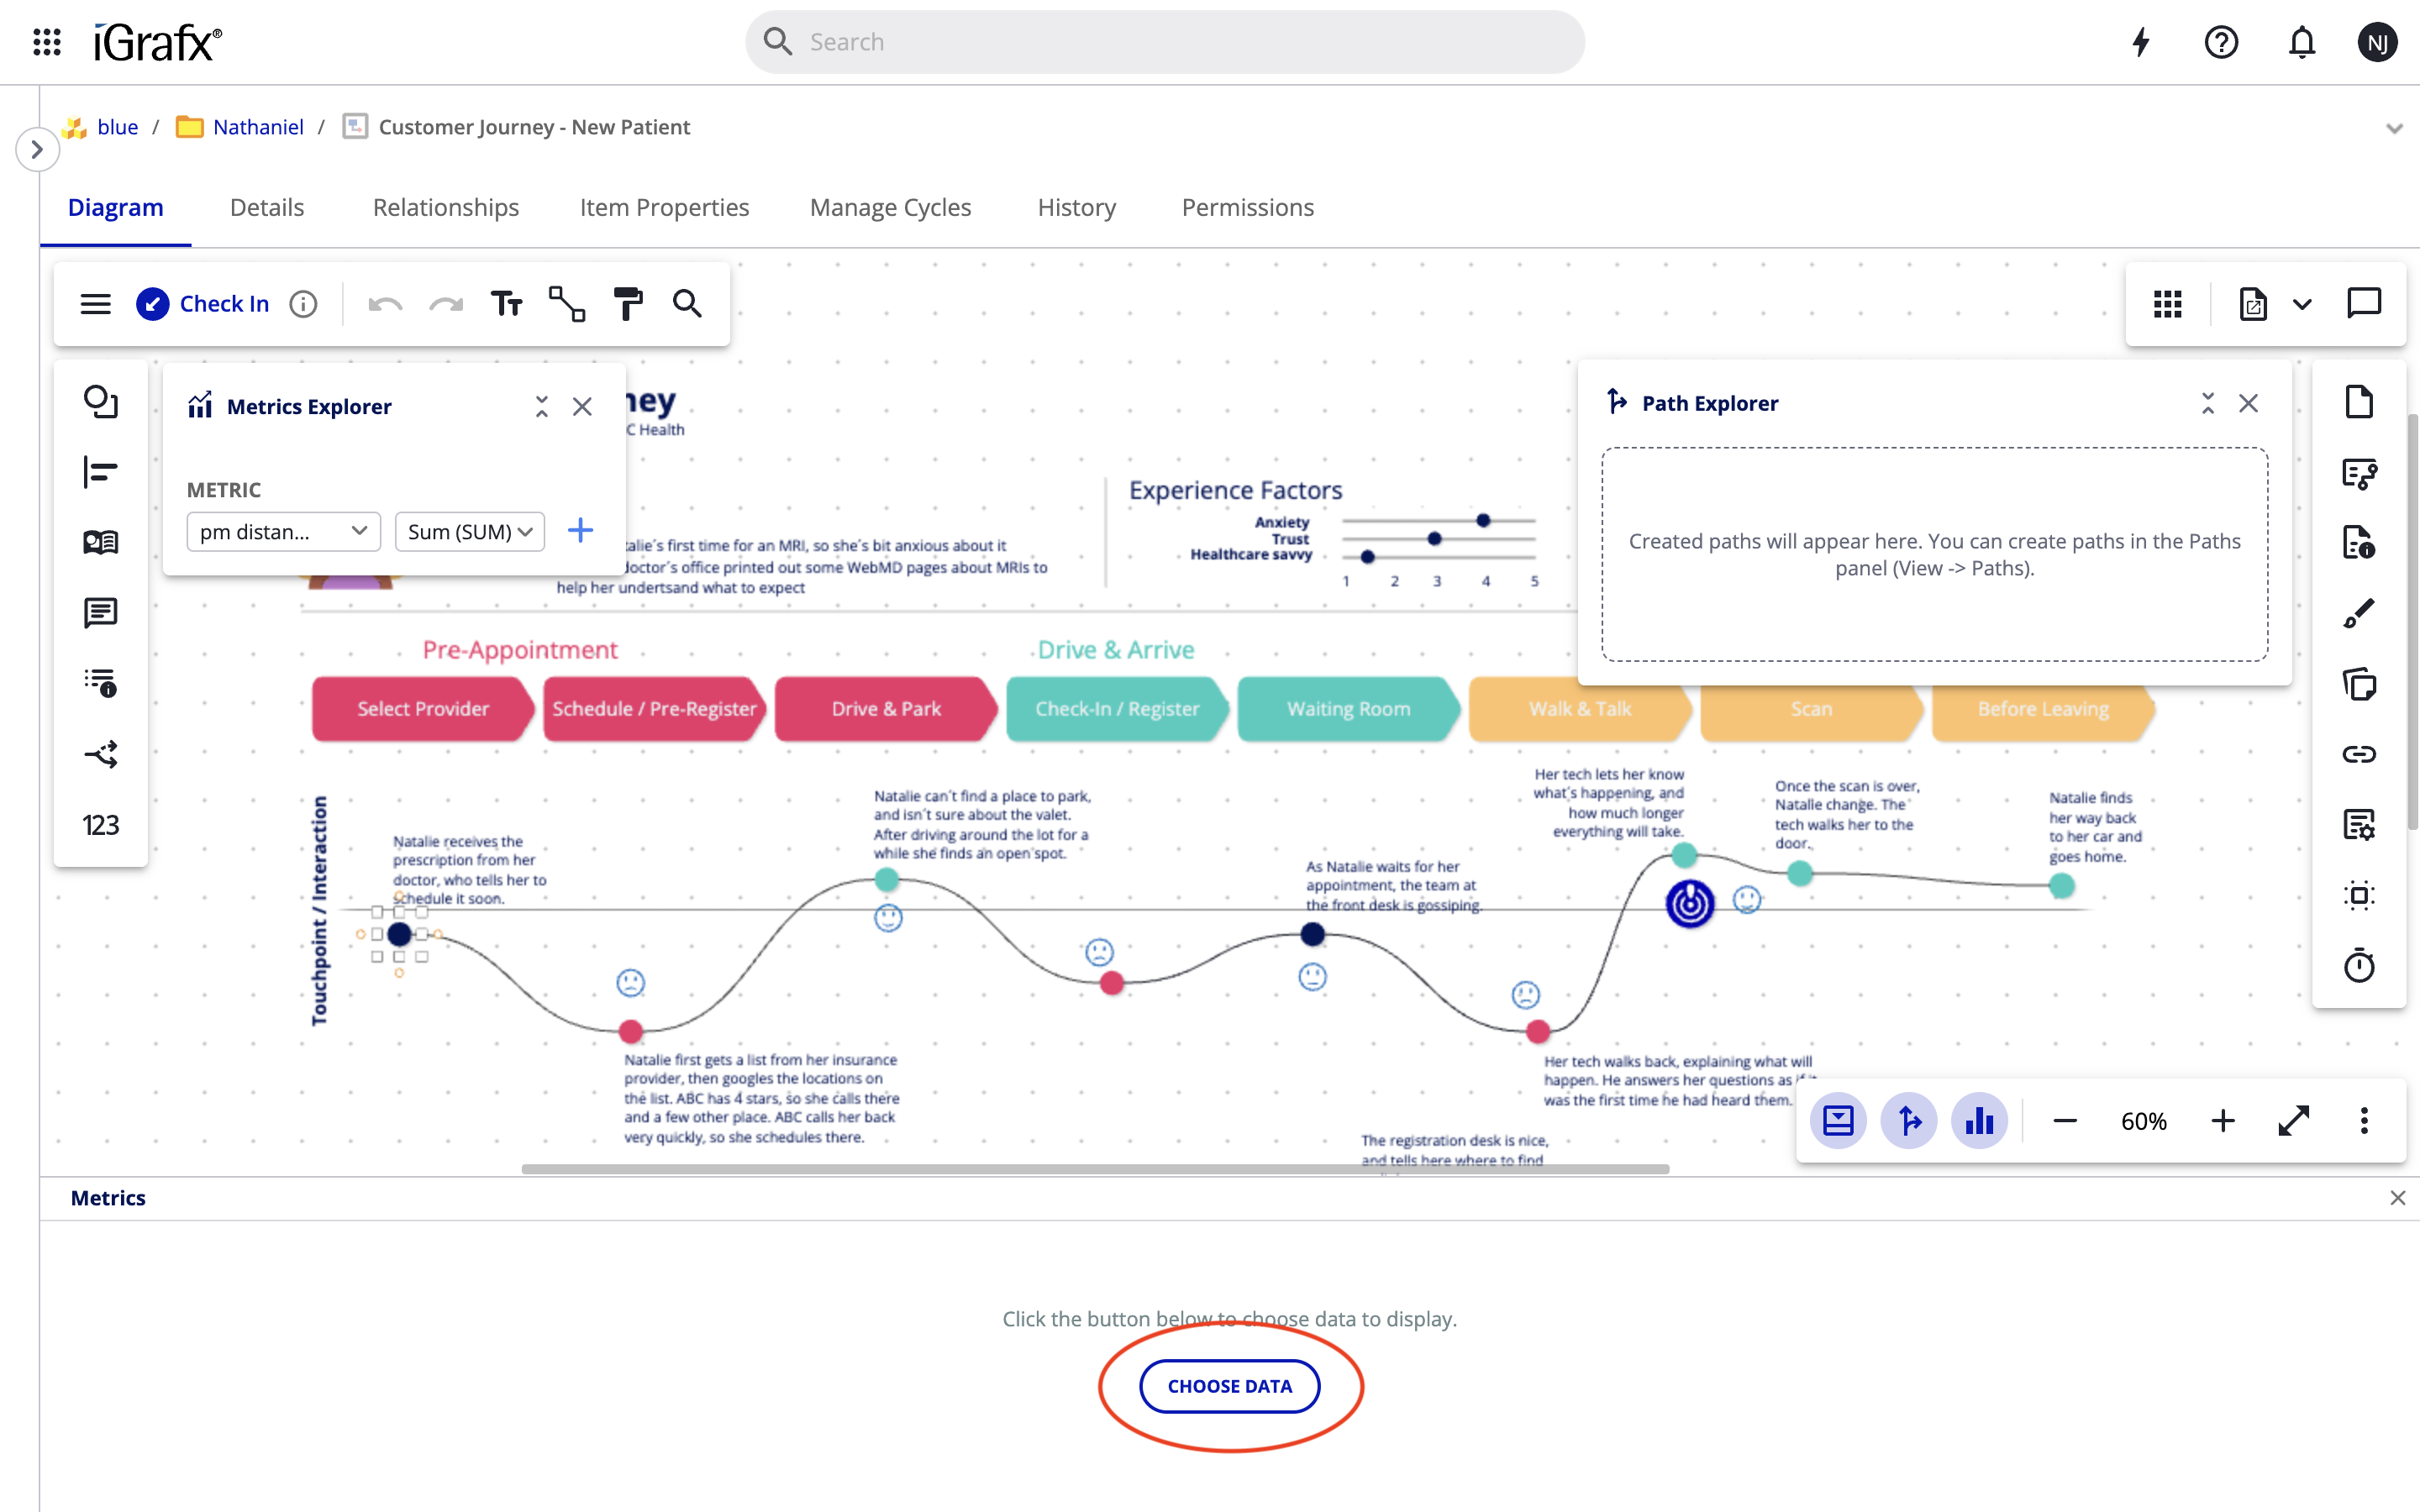
The Metrics Panel is located at the bottom of the diagram and is used to analyze metrics attached to shapes within the diagram. On the left side you will find the names of the metrics being displayed and their controls, on the right side of the panel you will find the metric totals (the sum of all shape values associated with the metric), and directly in the center of the panel you will find metric value displays for all of the relevant shapes in the diagram.
Click the Metrics Panel button in the view toolbar to open the Metrics Panel.
Adding your first metrics to the panel
-
Click the "ADD METRICS" button in the center of the panel.
This will open the “Show or hide metrics" dialog where you can select which metrics you want to display. Click the “Save” button to save your changes and close the dialog.
Changing which metrics are displayed
-
Open the menu on the left of the Metrics Panel by clicking on the three dots icon.
-
Select "Show or hide metrics."
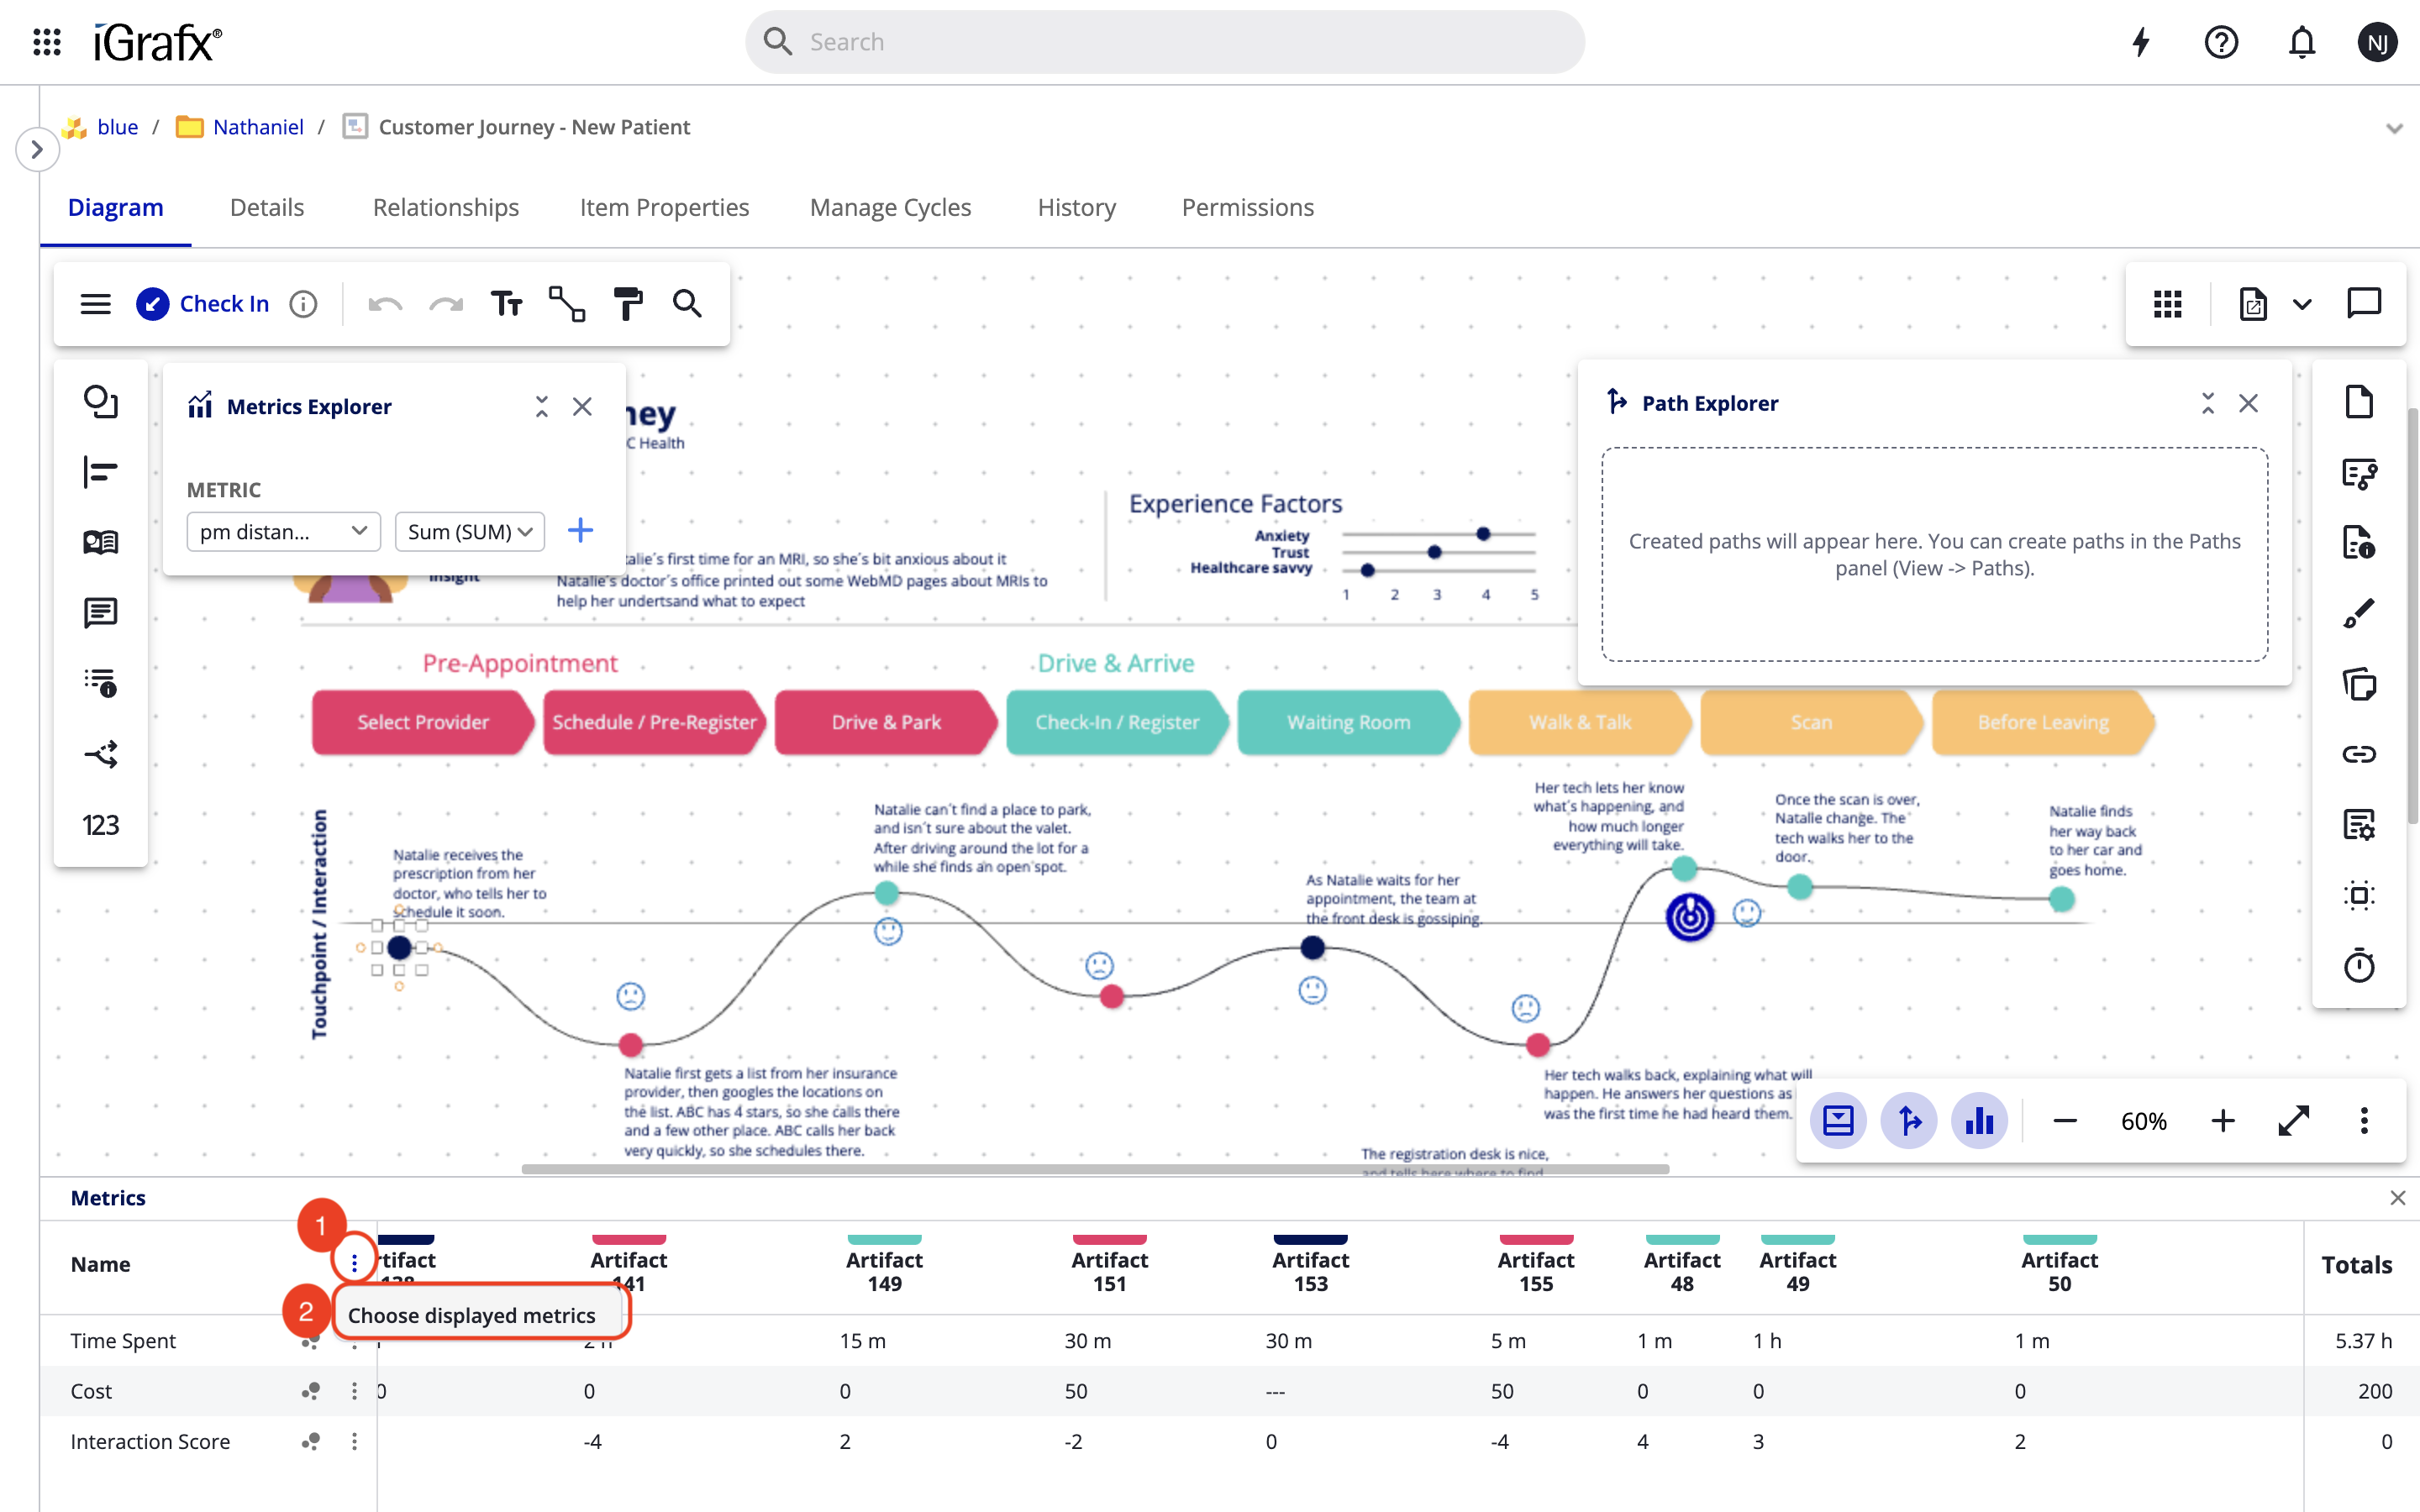
This will open the “Show or hide metrics" dialog where you can select which metrics you want to display. Click the “Save” button to save your changes and close the dialog.
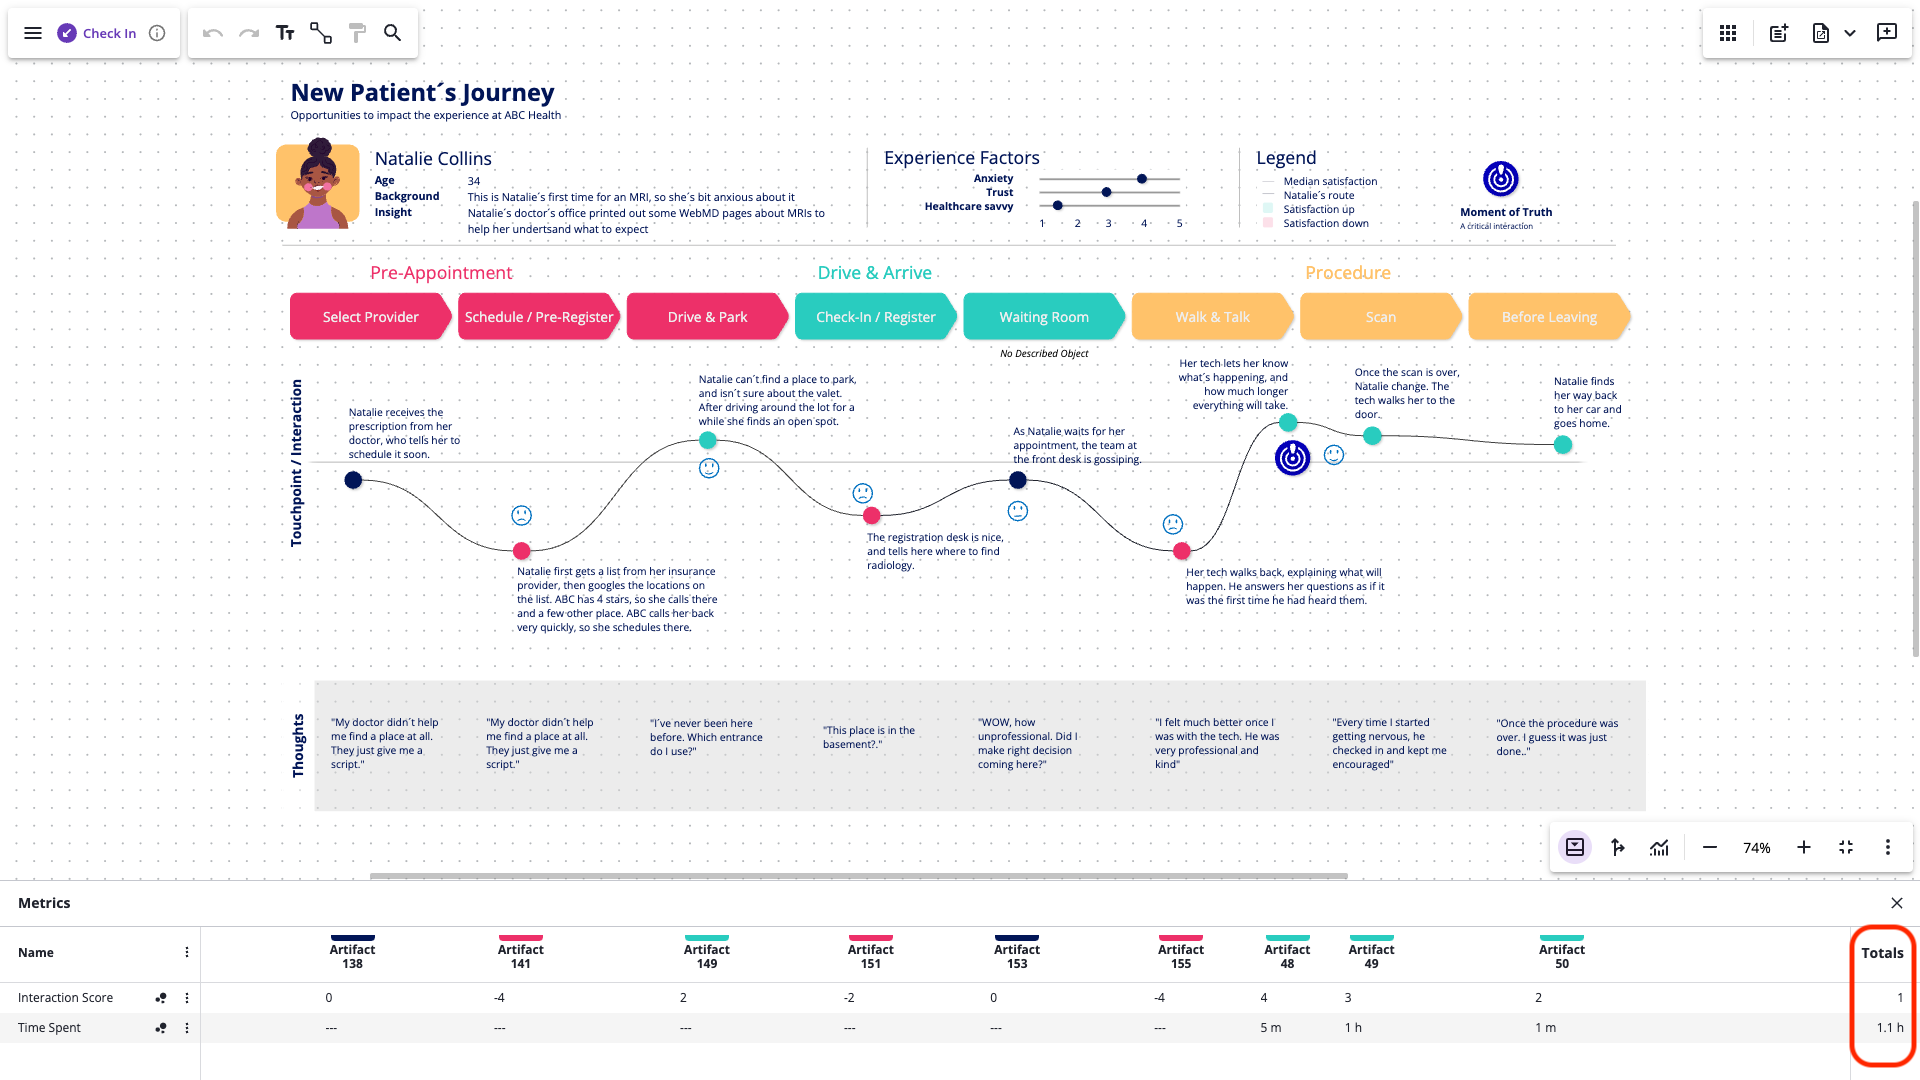
Totals
Totals can be viewed on the right side of the Metrics Table.
For Percent metrics, the total is the product of all values for a given metric.
For all other types of metrics, the total is the sum of all values for a given metric.
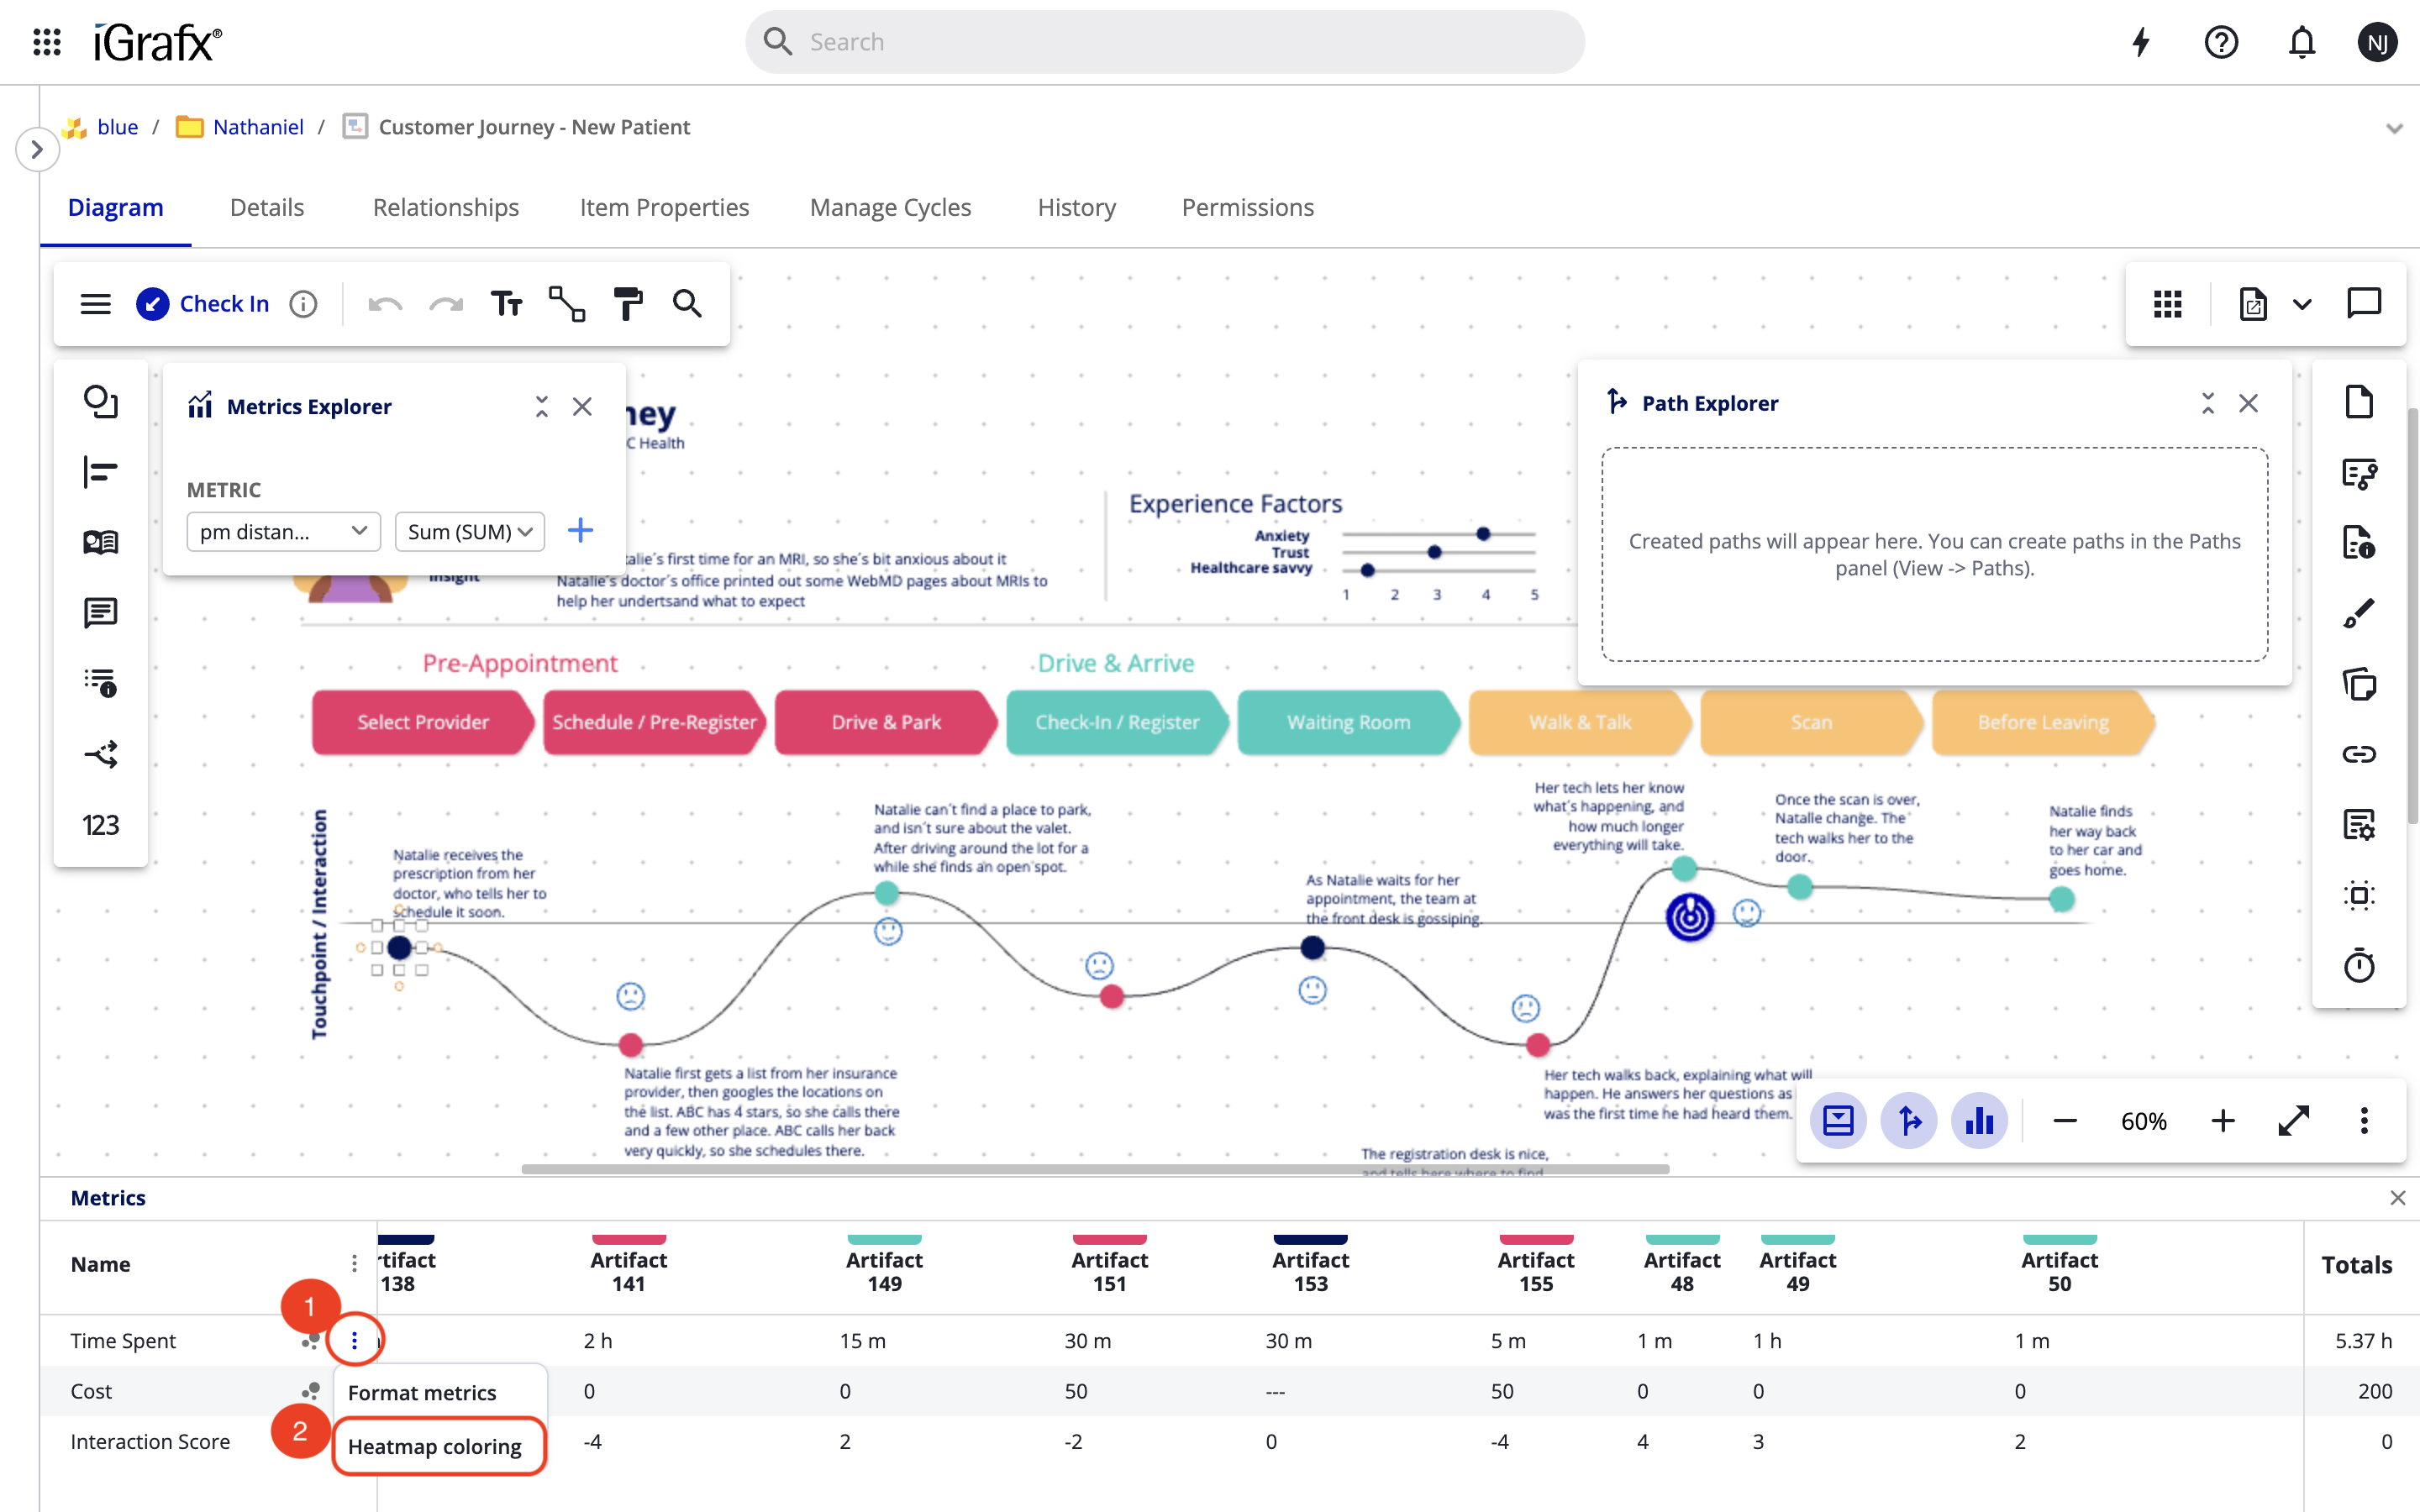
Formatting Metrics
-
Open the metric menu by clicking on the three dots icon to the right of the metric name.
-
Select "Format metrics".
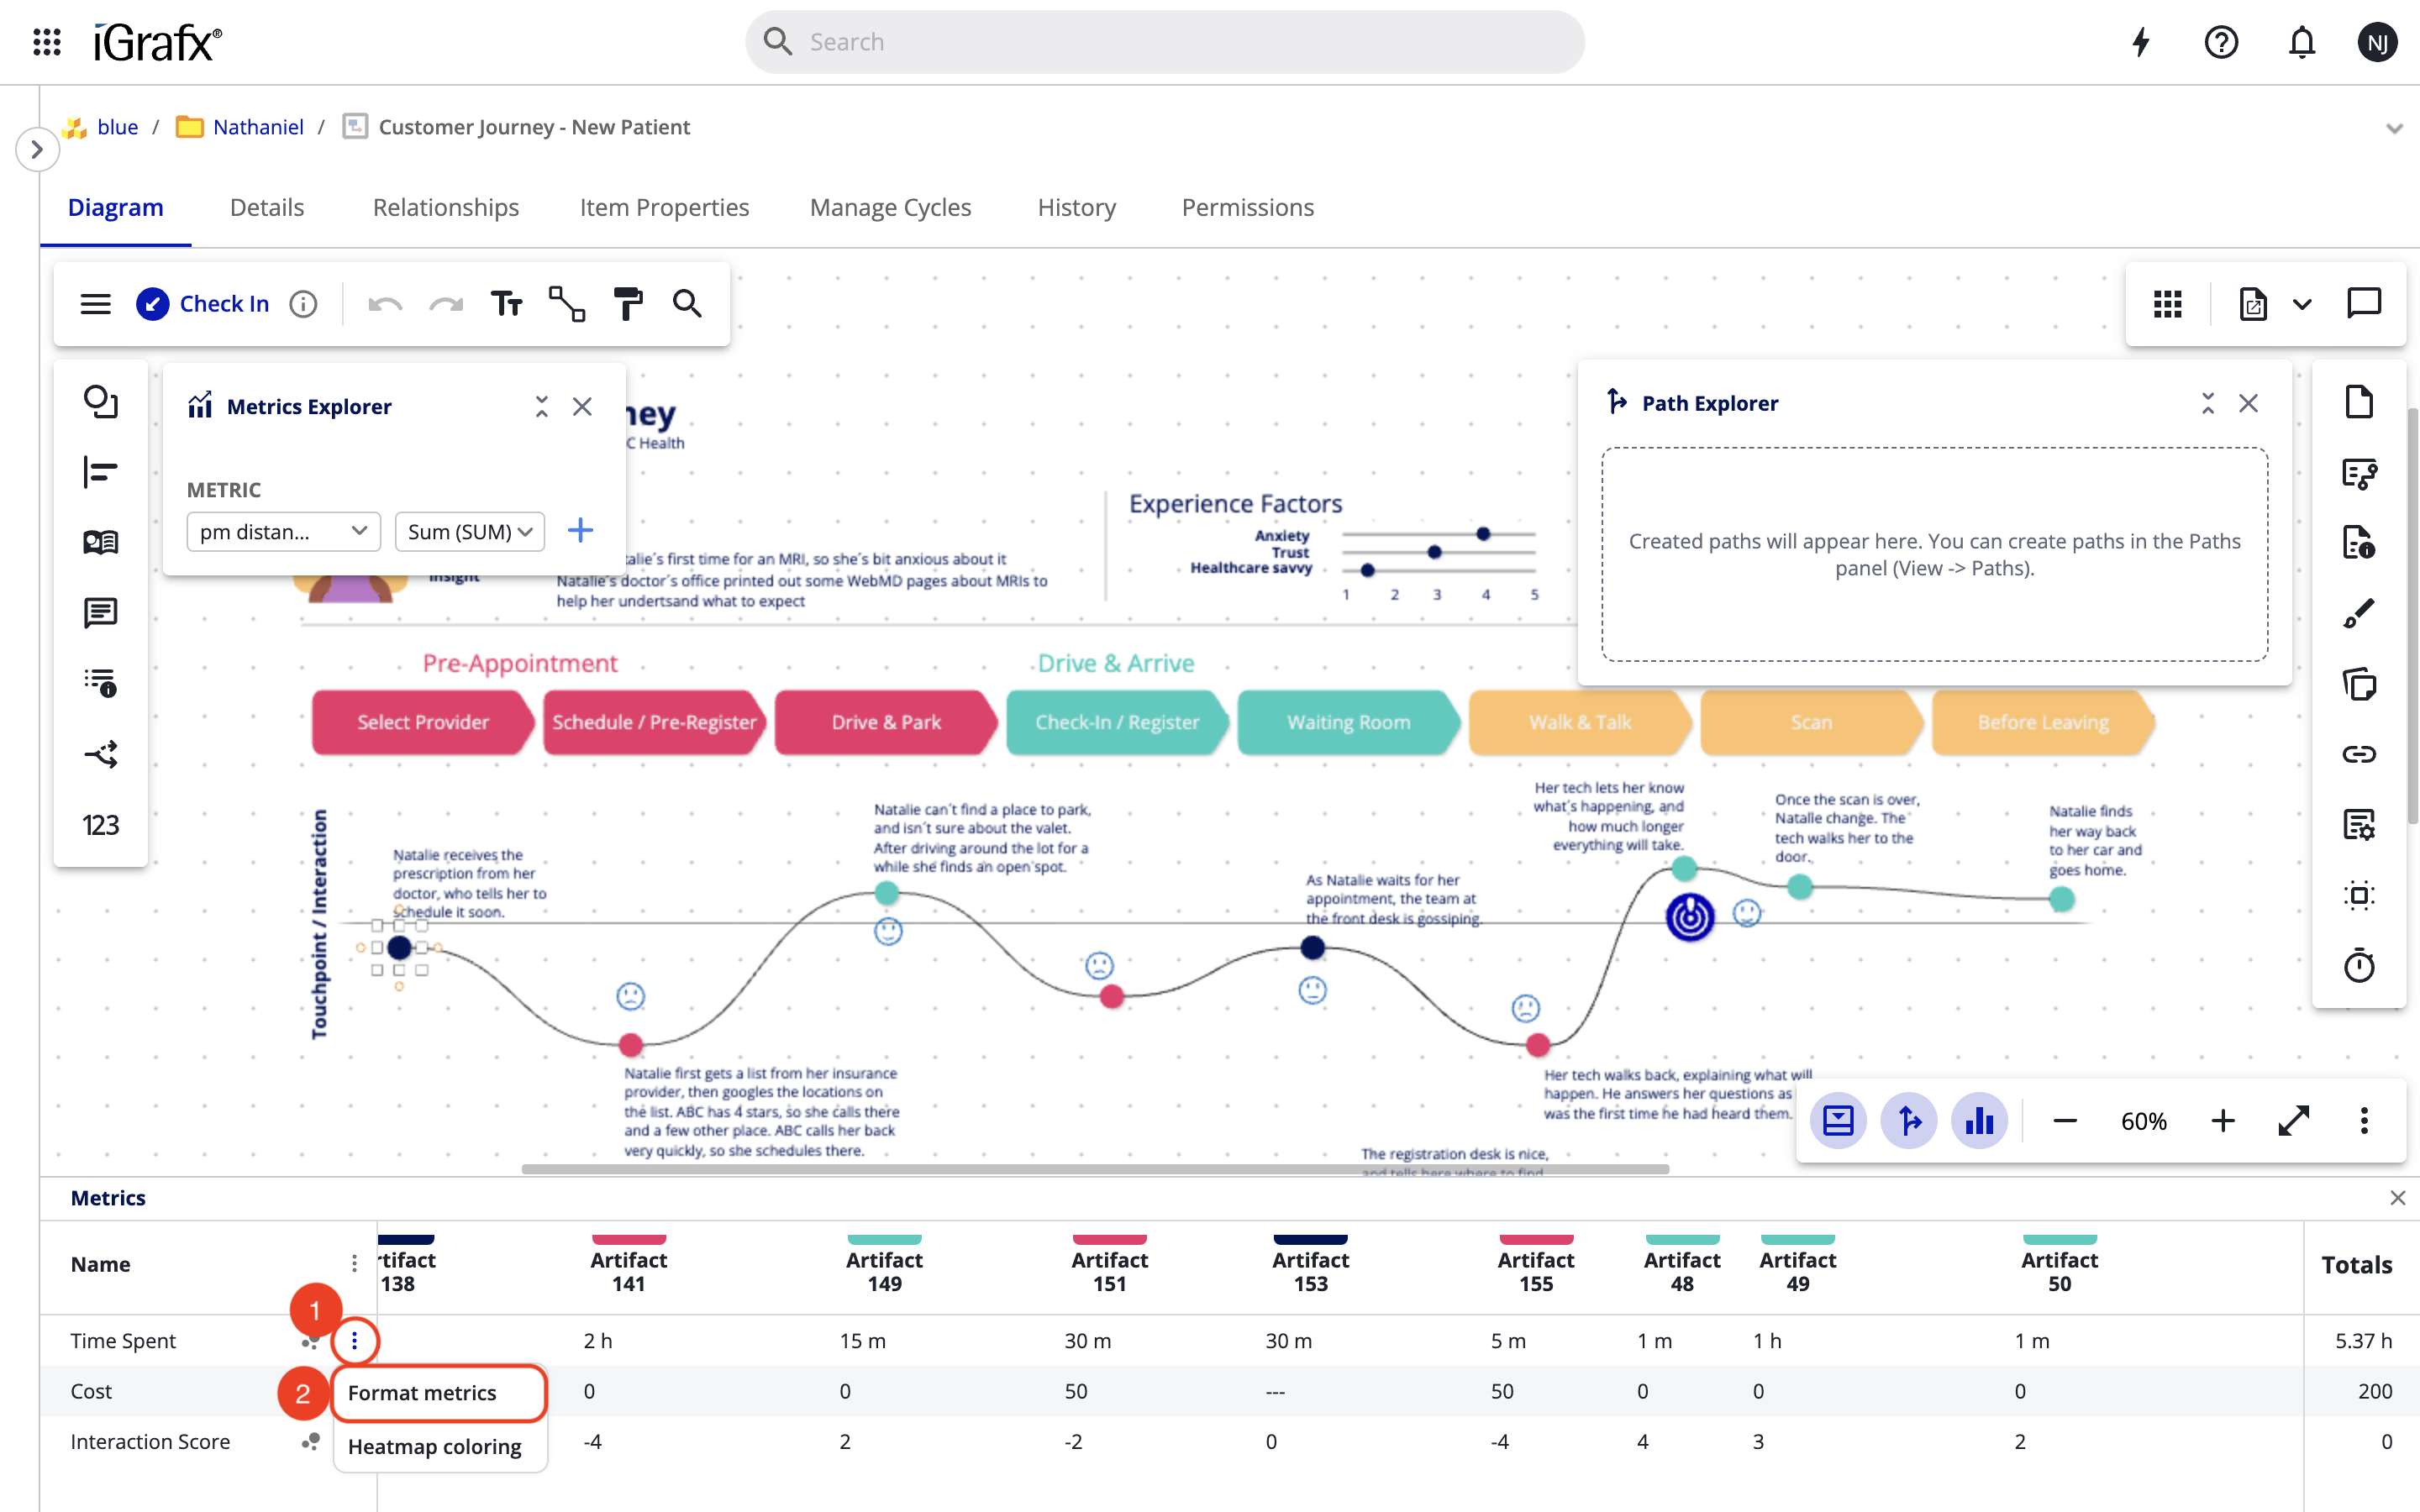
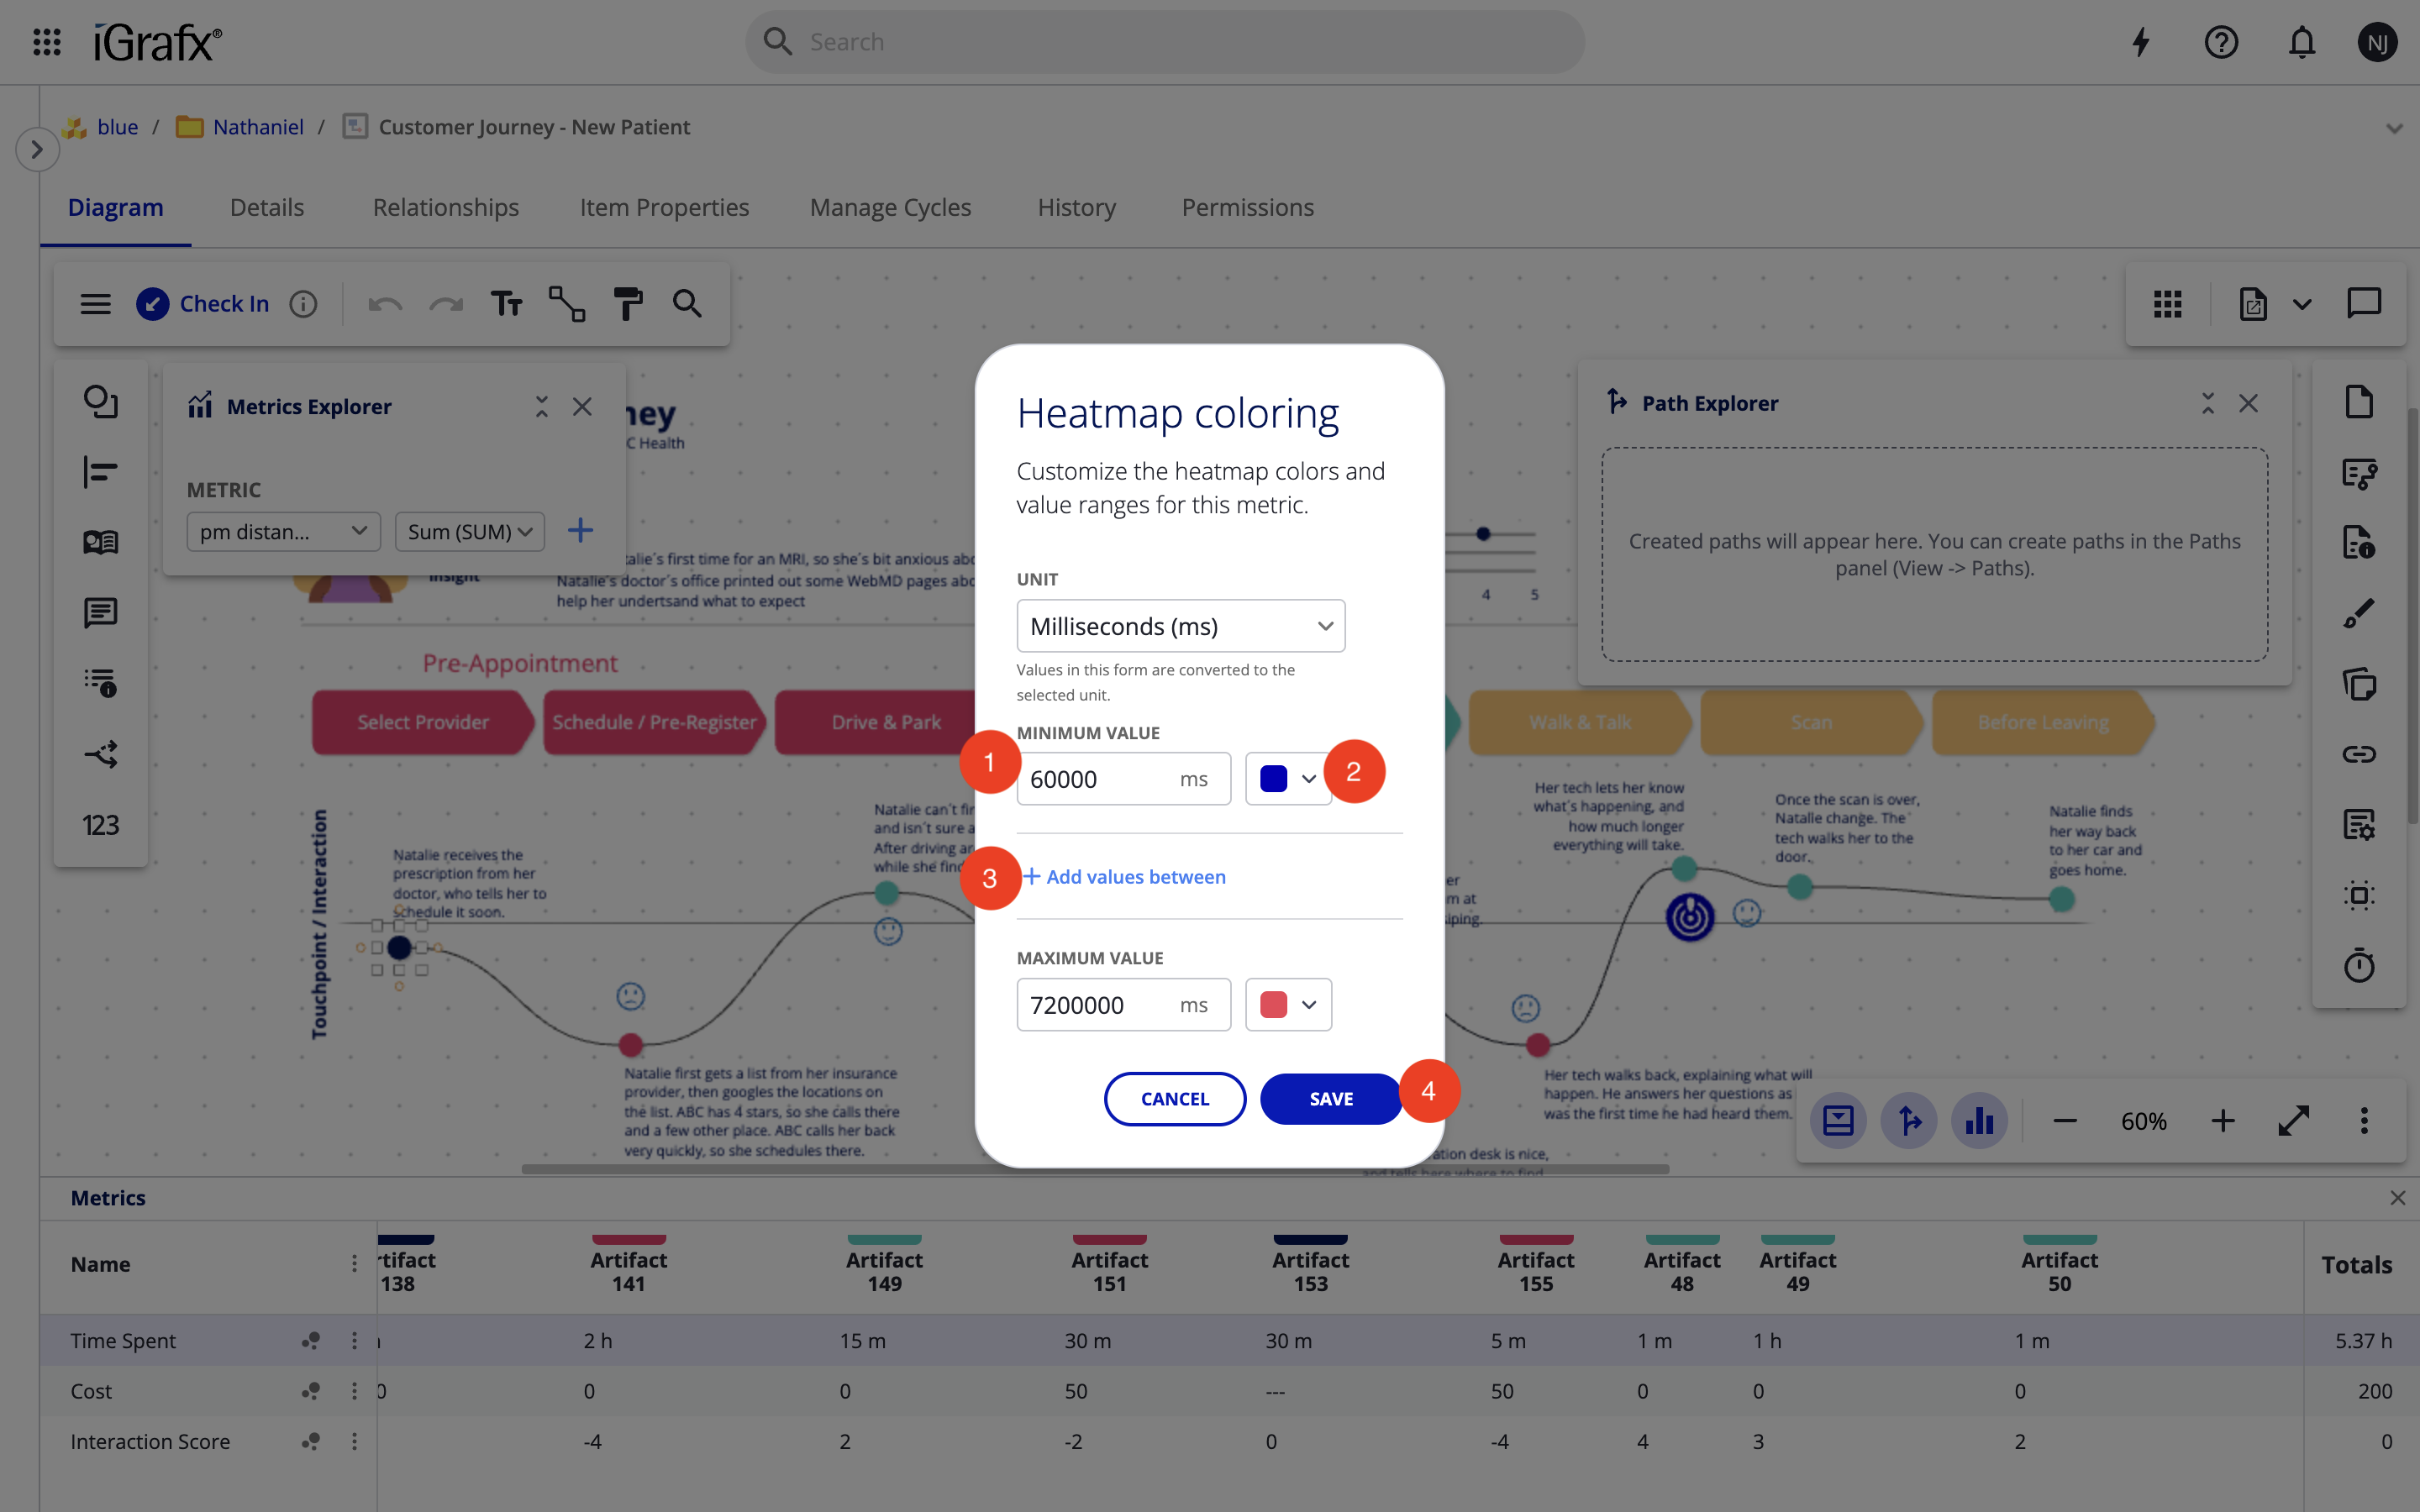
Configuring Heatmap
-
Open the metric menu by clicking on the three dots icon to the right of the metric name.
-
Select "Heatmap coloring".
-
Click on a value field to change the range of the heatmap bucket.
-
Click on a color field to change the color of the heatmap bucket.
-
Click the Add values between button to create a new bucket.
-
Click Save to save your changes.
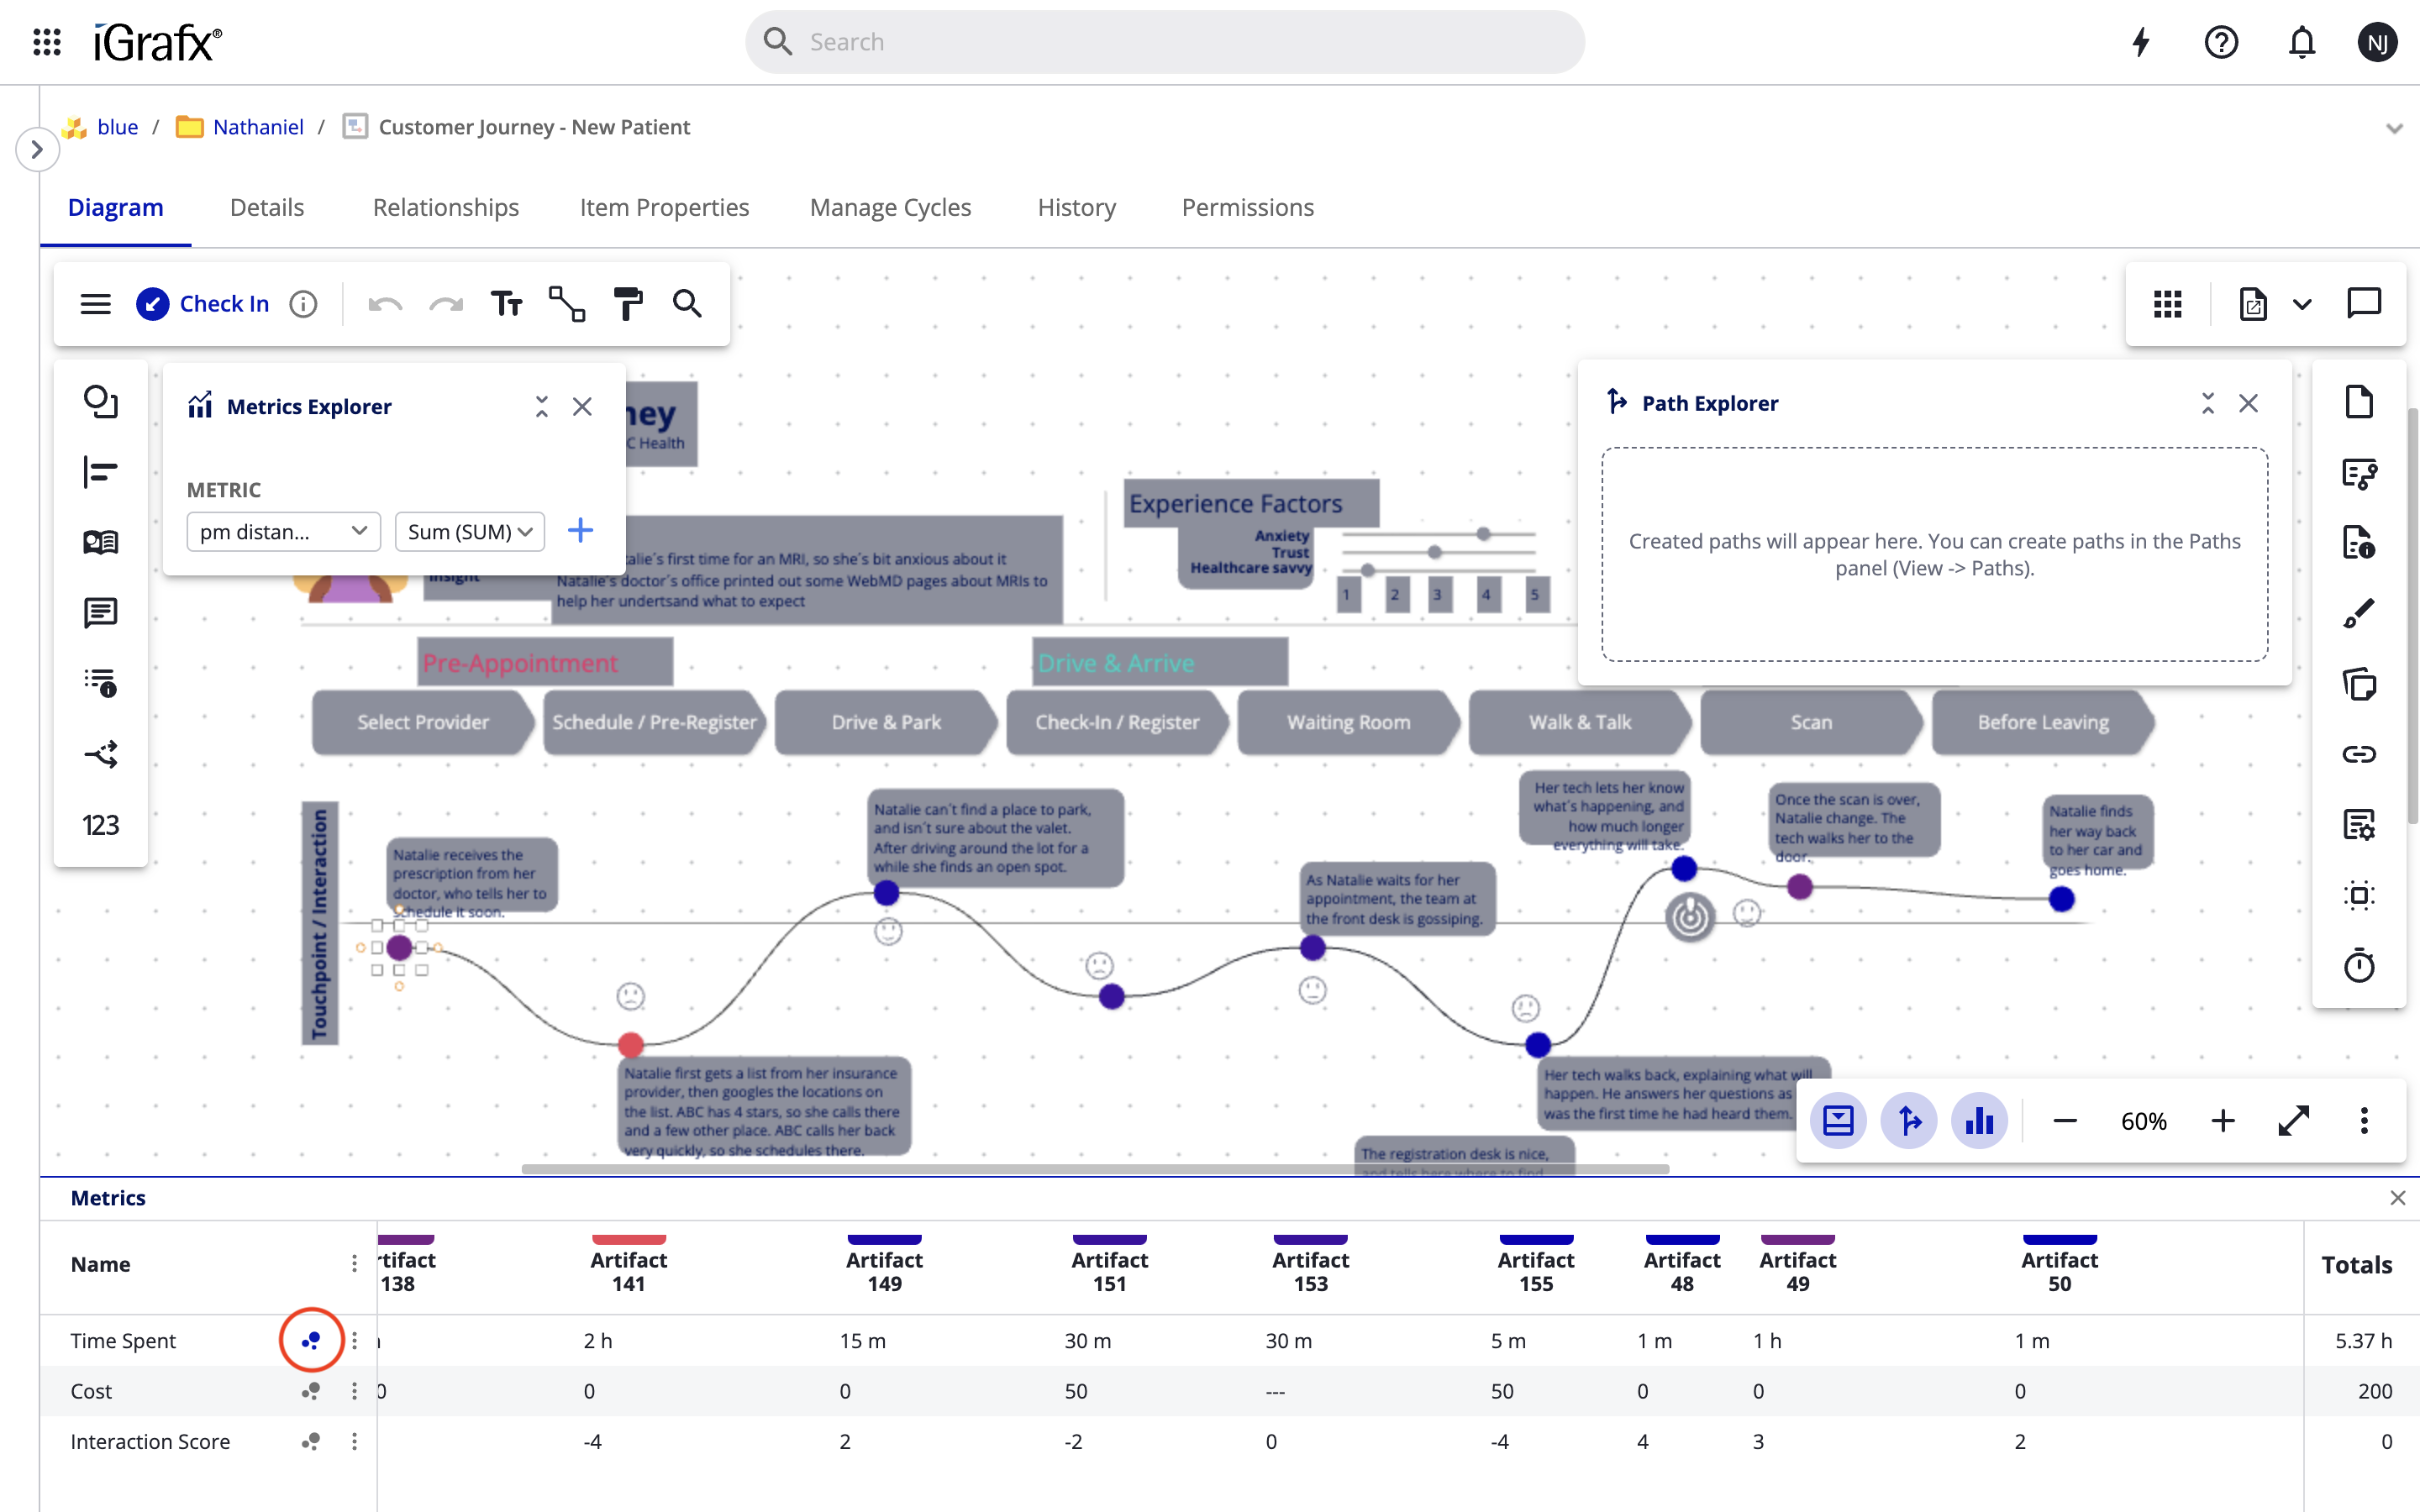
Enabling Heatmap
-
Click the heatmap button to the right of a metric to enable heatmap for that metric.
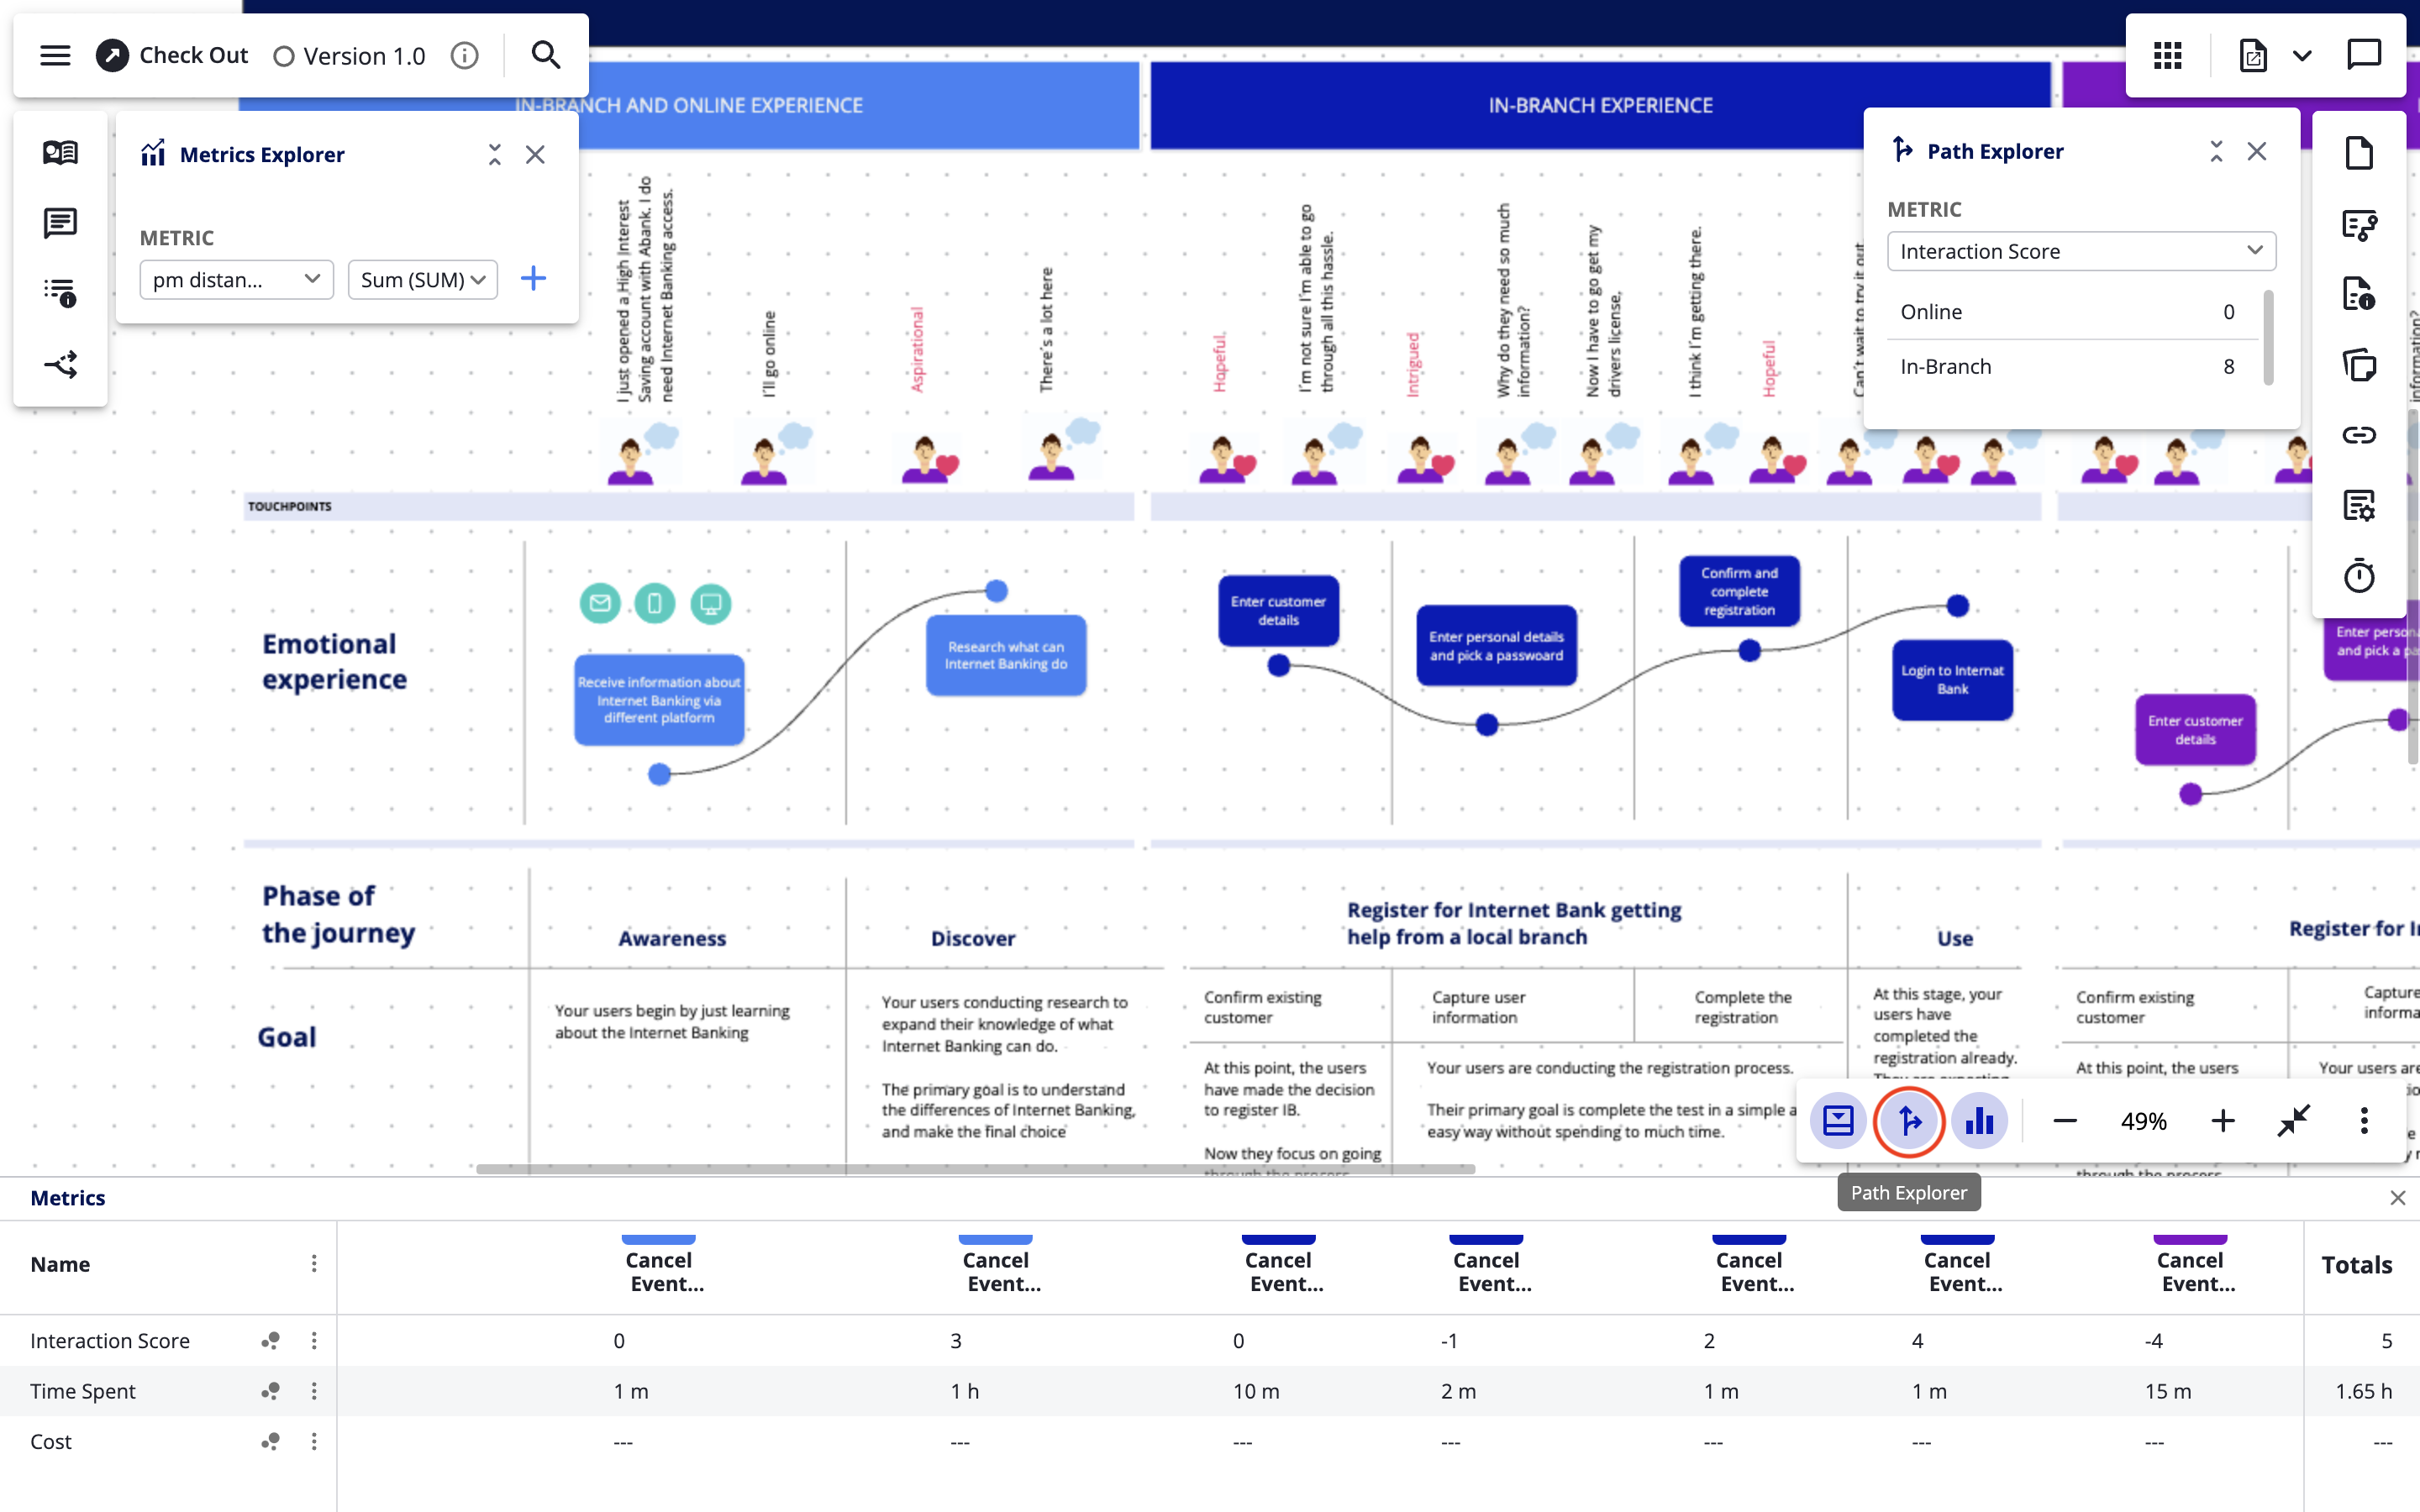
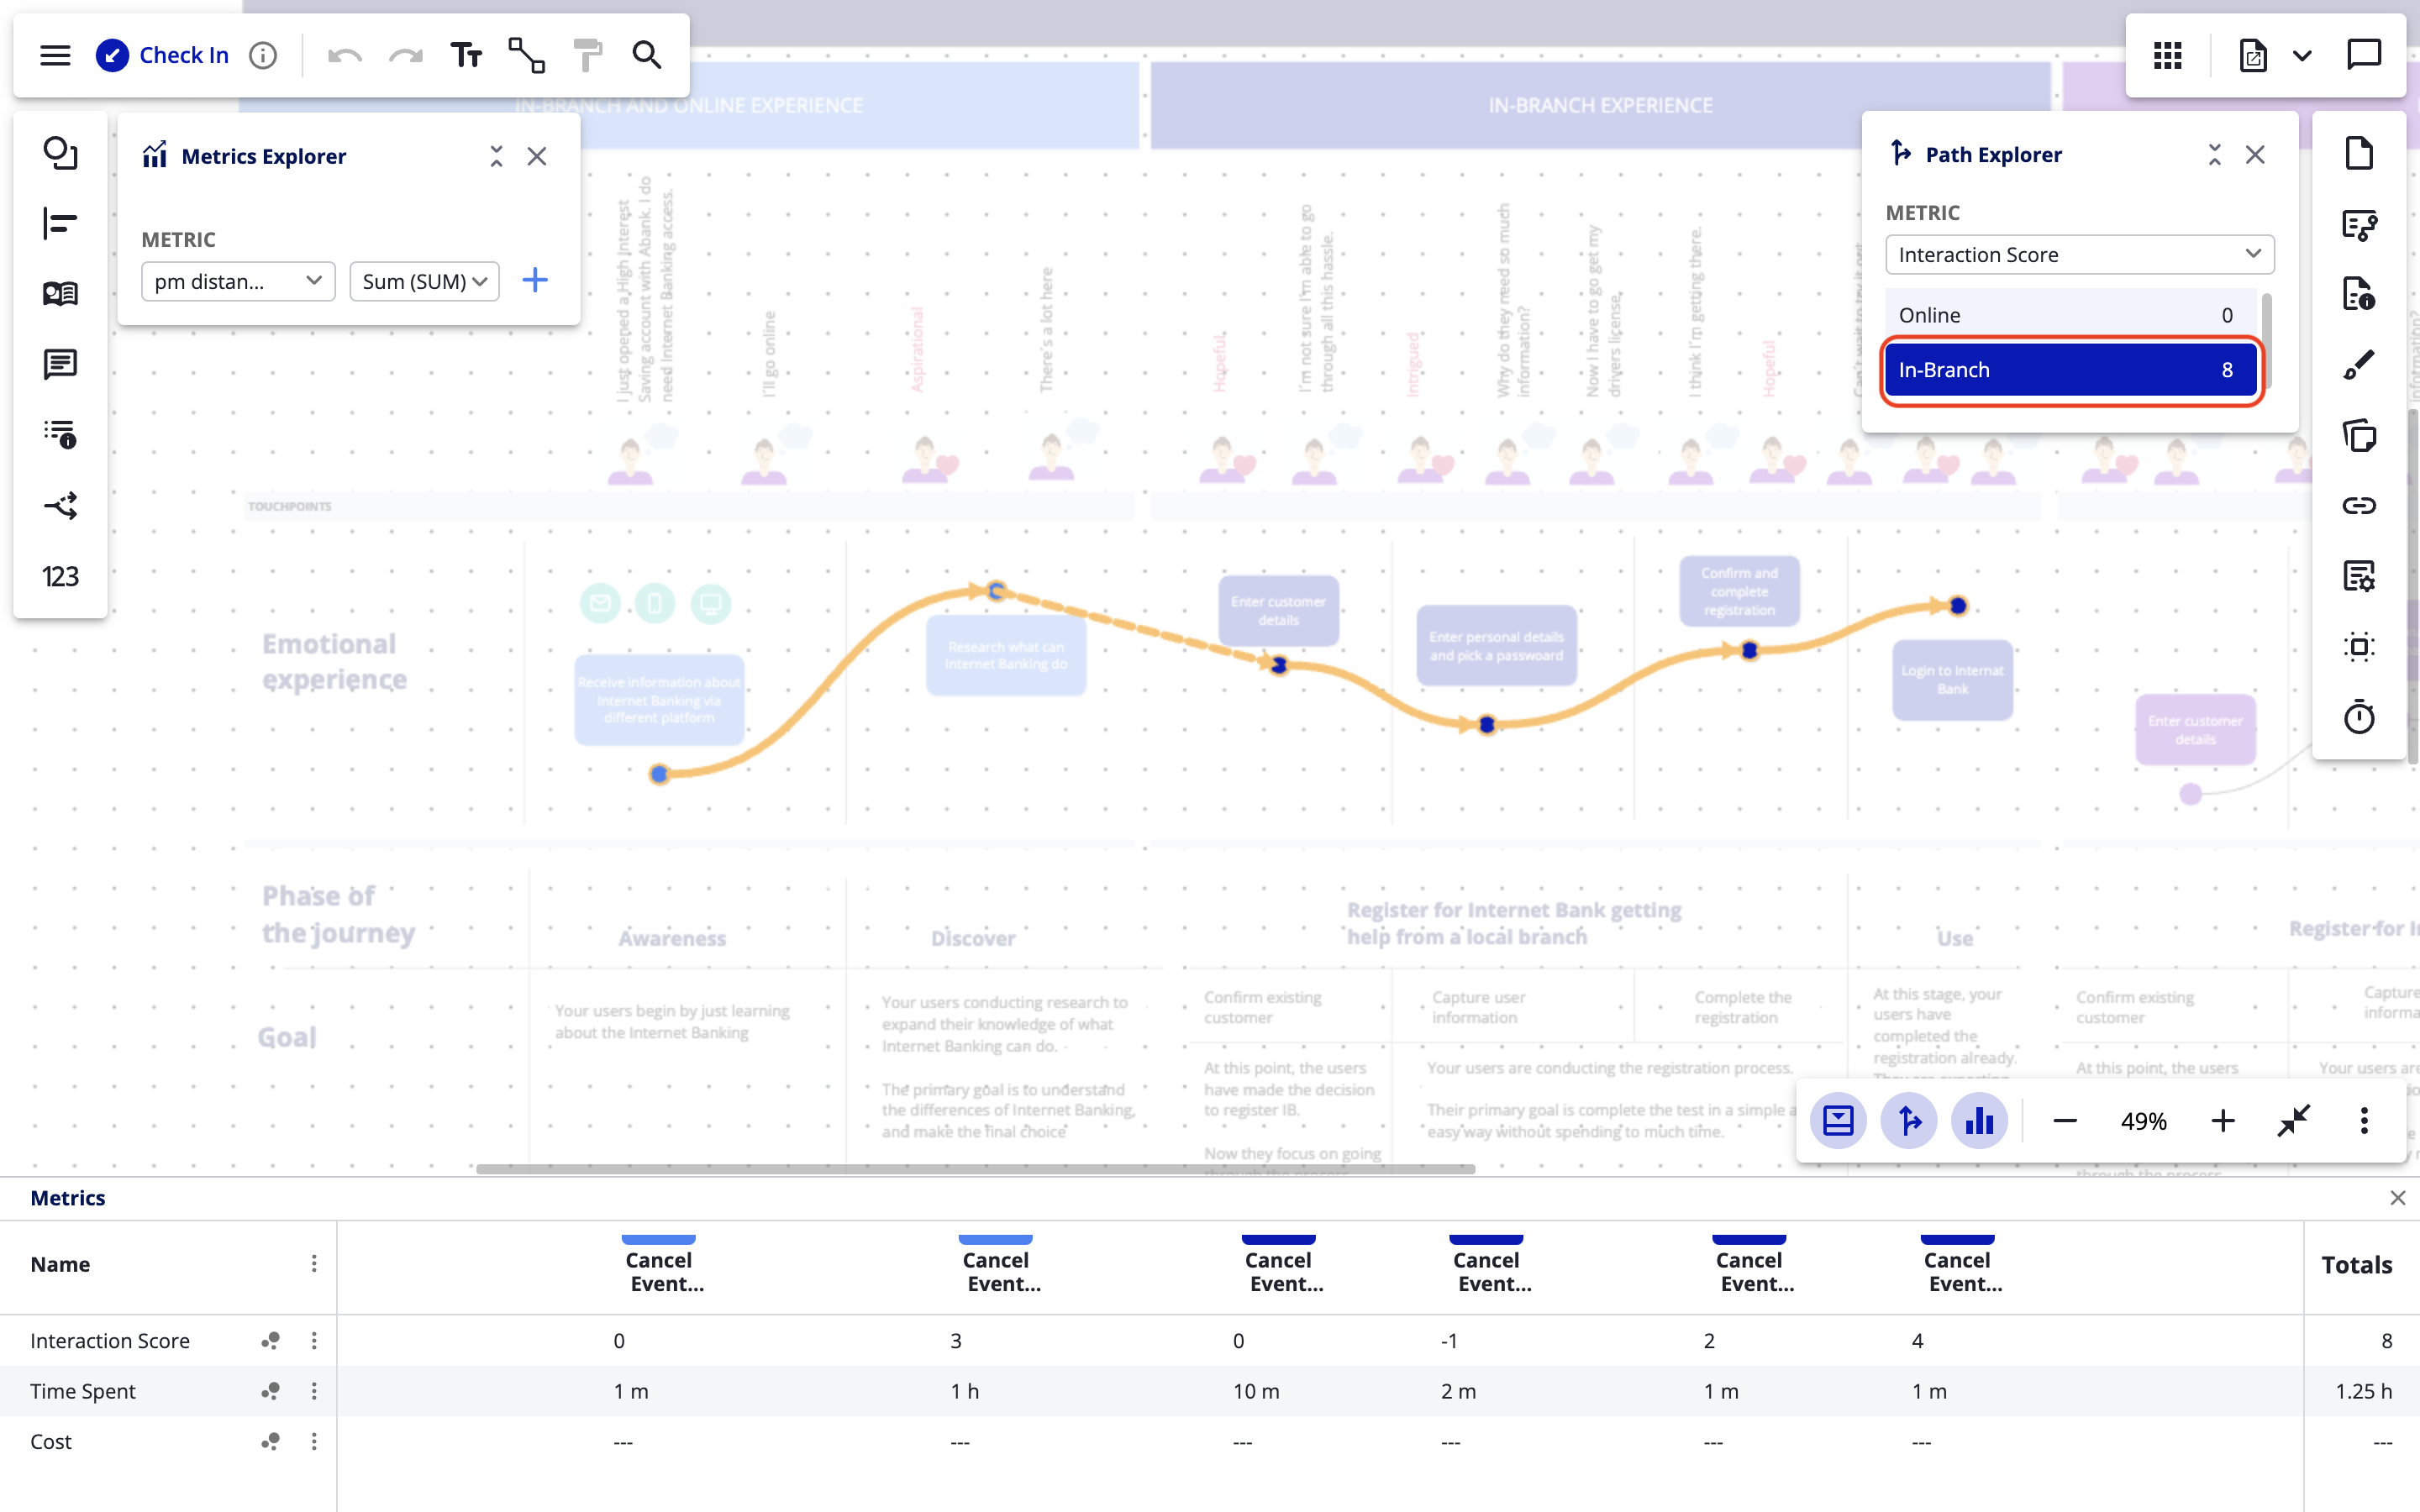
Path Explorer
The Path Explorer is used to analyze paths in your diagram and their related metrics. It will display the diagram paths alongside the sum total of the shape metric values along the respective path, clicking on a path will highlight the path in the diagram and will filter the metrics displayed in the Metrics Panel based on the selected path.
Opening the Path Explorer
-
Click the "Path Explorer" button in the top toolbar.
Adding a Path
-
Click Paths in the sidebar.
-
Click the Add path button in the opened Paths panel.
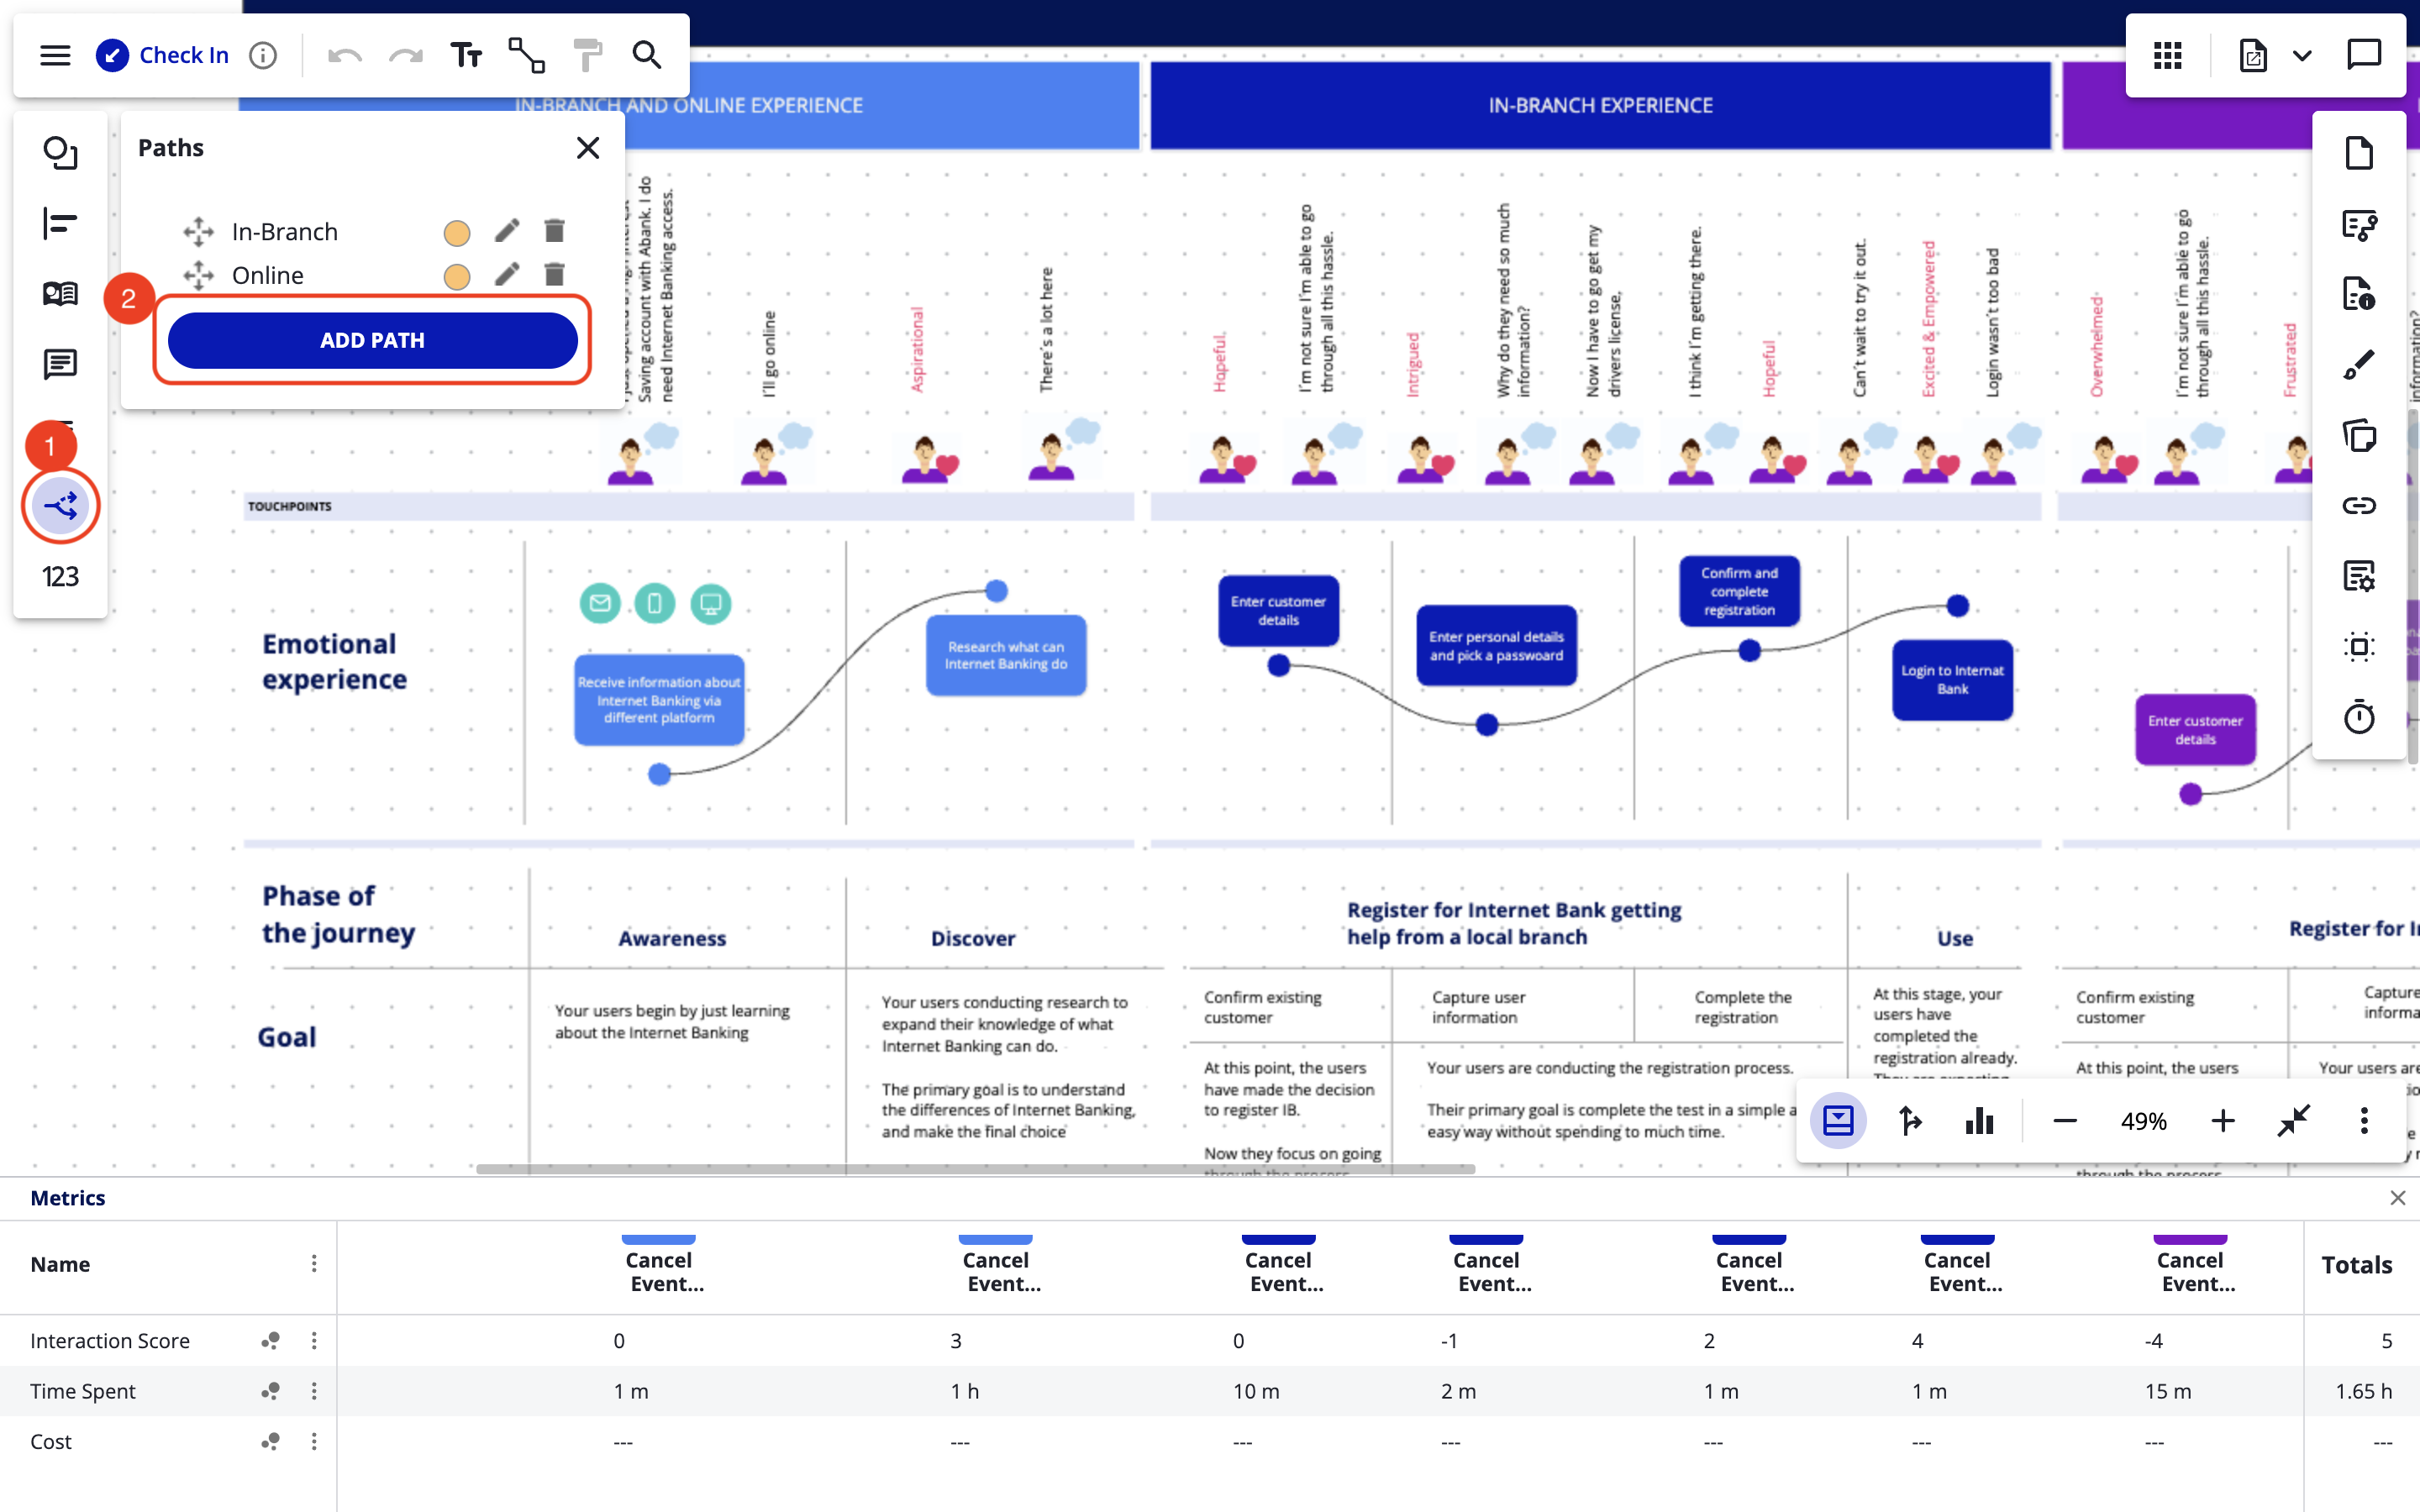
Fill out the path information in the opened form, select the shapes in the path using the diagram, and click the "FINISH" button when you are ready to create the path.
Highlighting Paths
-
Click on a path in the Path Explorer.
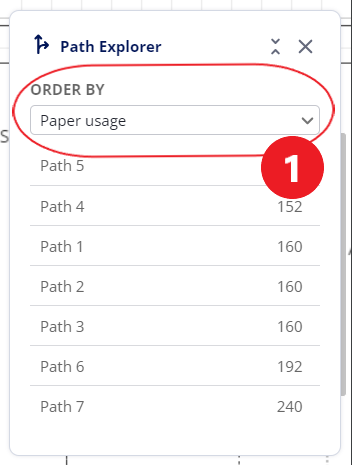
Sorting Paths by Metrics
-
Use the "ORDER BY" dropdown to choose a metric. This sorts the paths in the Path Explorer in ascending order of the sum of the metrics in the path.
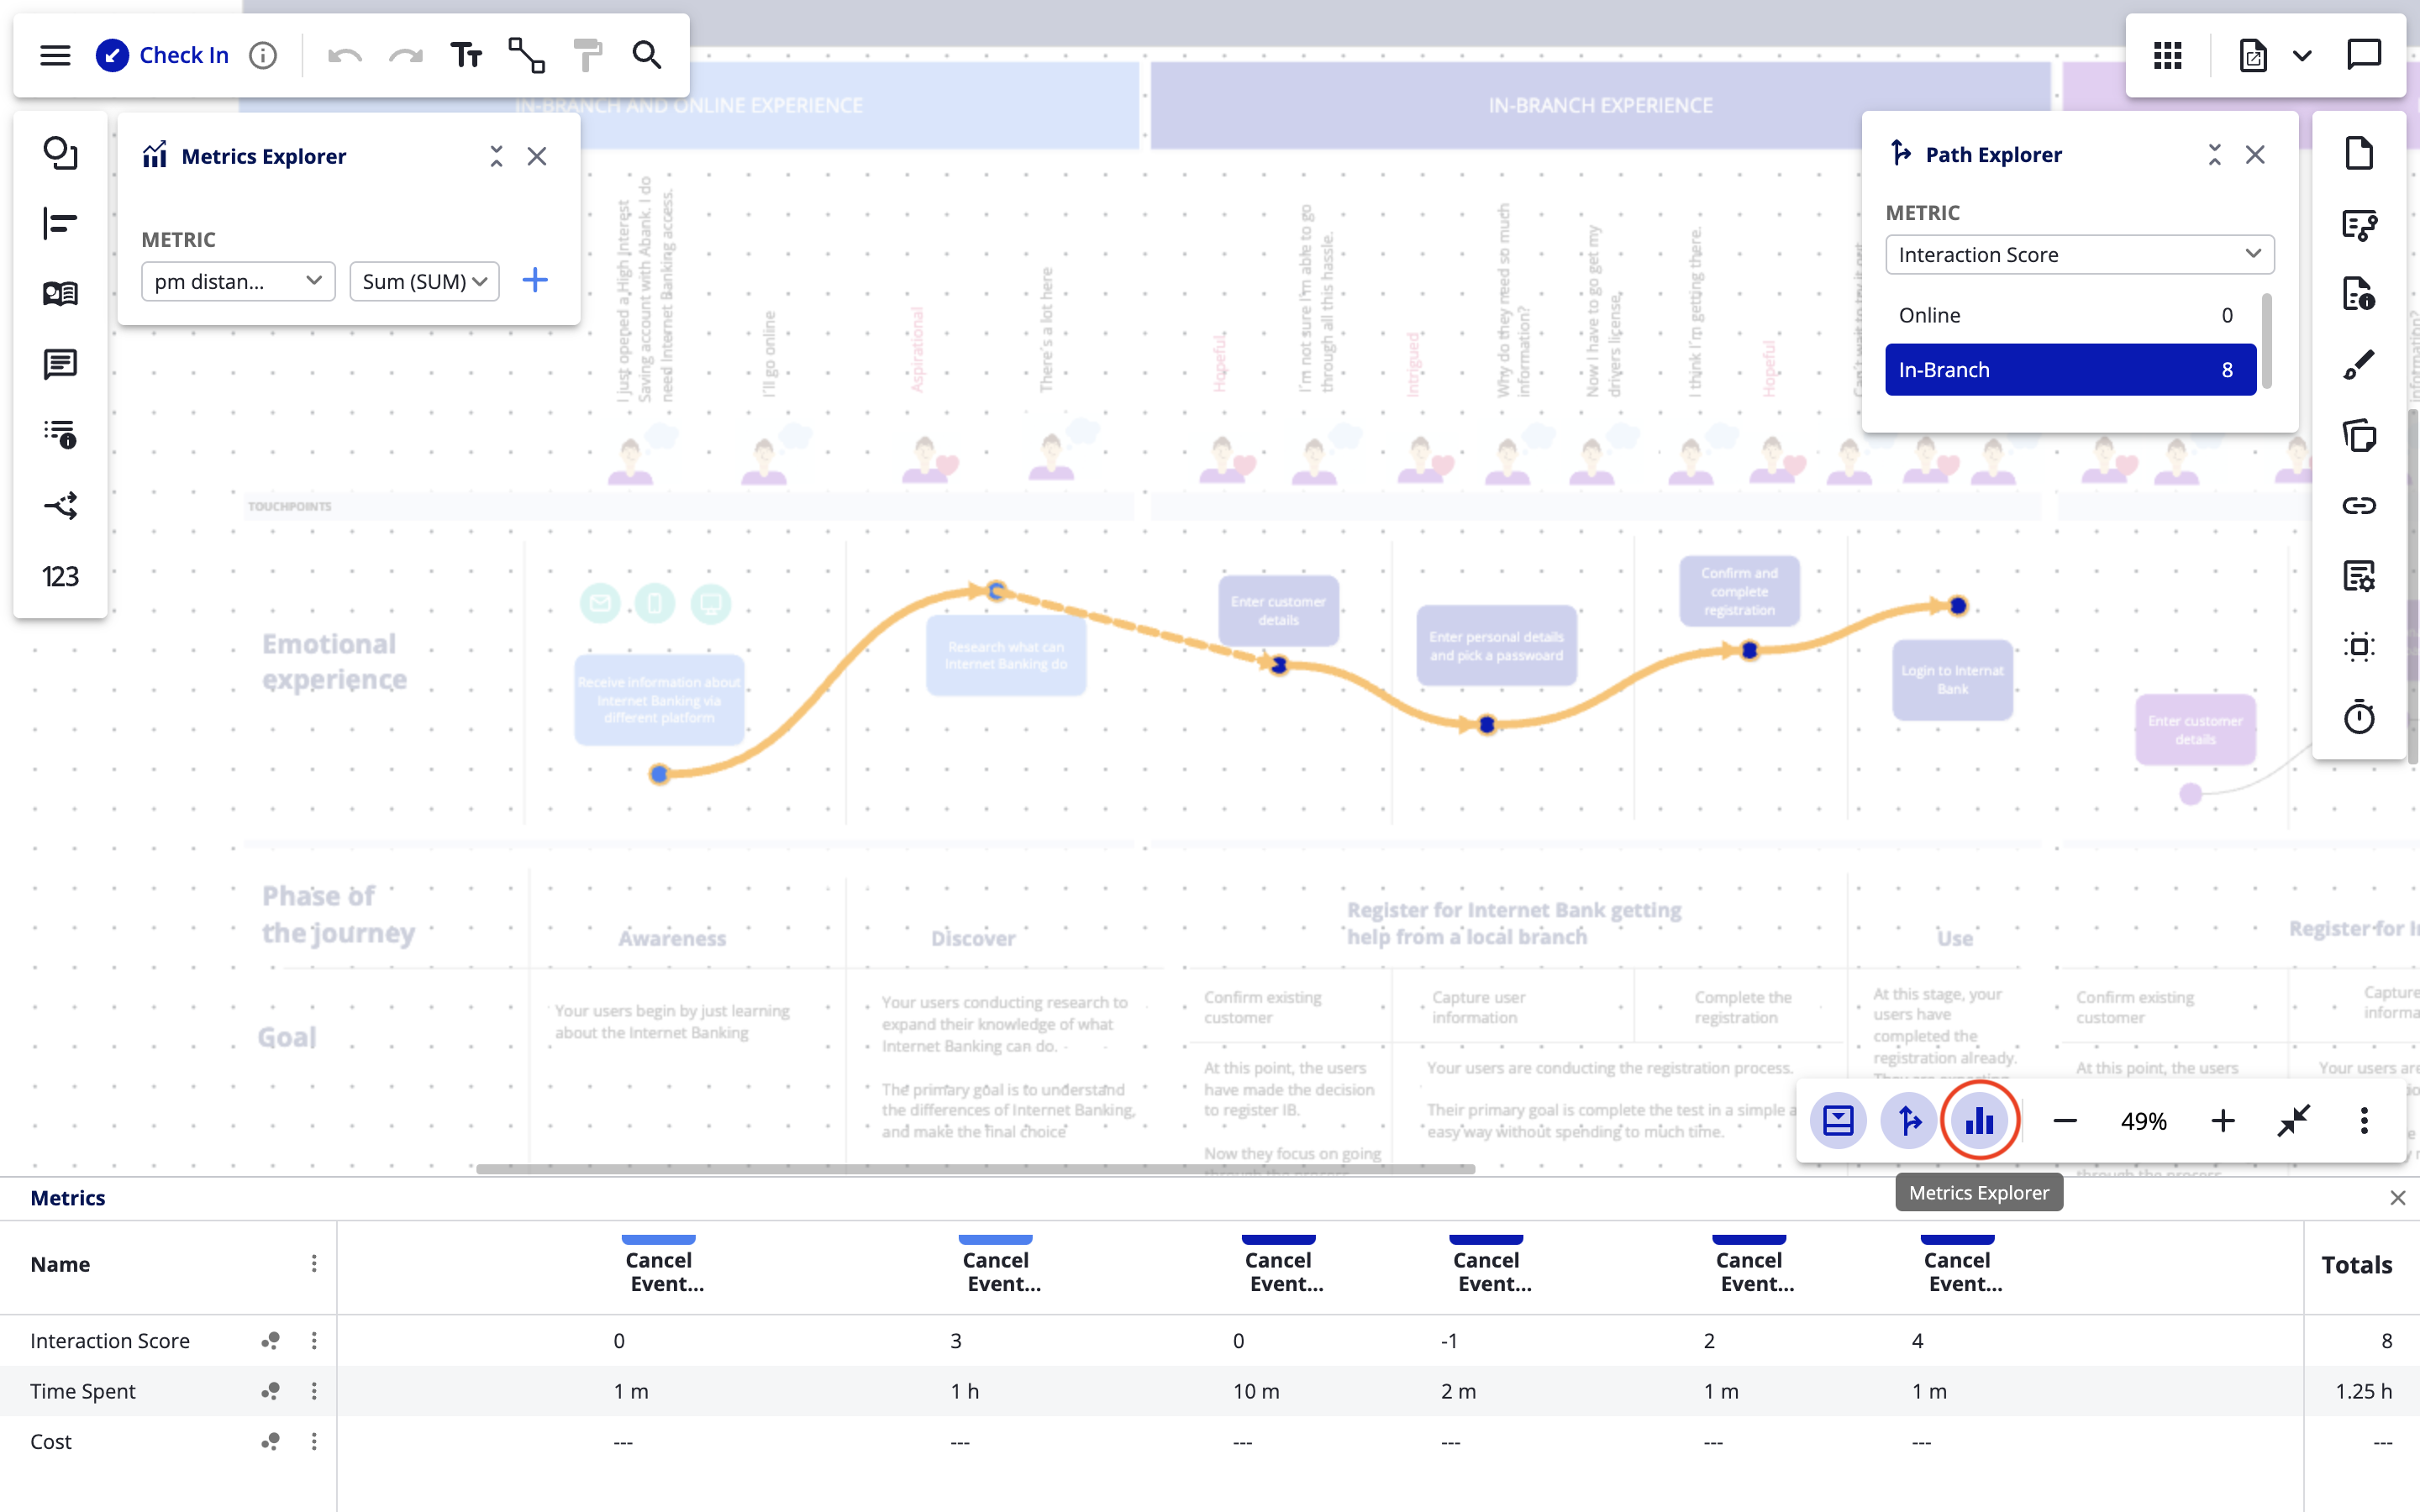
Metrics Explorer
The Metrics Explorer allows you to analyze all of the different metrics in your diagram. When adding a Shape metric to the Metrics Explorer you can choose an aggregation function (sum, average, standard deviation, etc.) to determine how the aggregate value gets calculated.
Opening the Metrics Explorer
-
Click the "Metrics Explorer" button in the top toolbar.
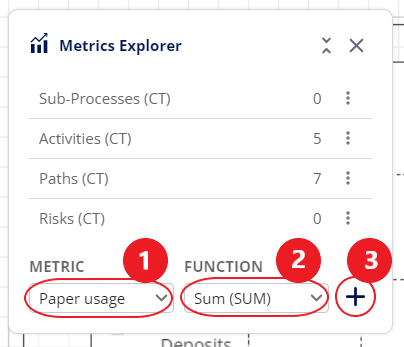
Adding a Metric
-
Select a metric in the “METRIC” dropdown.
-
Select an aggregation function in the “FUNCTION” dropdown
-
Note that aggregation functions are only required for Shape metrics.
-
-
Click the add button.
Note: Some property types cannot be summarized and will not show in this list. For example, if the value of a property is a ‘Selection List’ then there is no way to calculate a Sum, Average, etc. on the values in the list.
Types of aggregation functions
Sum
The sum is calculated by summing all values for that metric.
Average
The average is calc
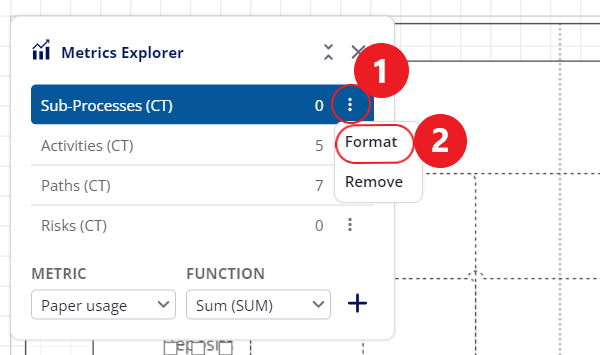
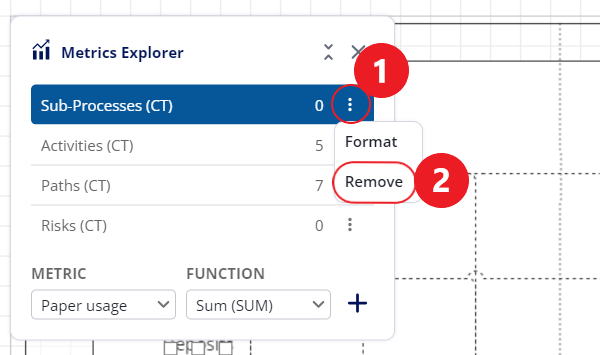
Removing a Metric
-
Open the menu for the metric by clicking on the three dots icon to the right of the metric name.
-
Select "Remove".
Formatting Metrics
-
Open the menu by clicking on the three dots icon to the right of the metric.
-
Select "Format".