A Designer, Architect or Creator license is required to create and edit reports (or equivalent User Extensions).
There are five types of reports available:
-
Generic List or Table: A table of objects and related properties or relationships to other objects.
-
Text Search: Similar to Generic List or Table reports but can be filtered by a search term.
-
Generic Matrix: A grid displaying relationships between objects.
-
Risk Map: A graphical risk map for specified objects.
-
Narrative Template: A collection of configured reporting sections that detail a Web diagram or IGX diagrams contents and related objects.
View Reports
-
Navigate to your desired report via the Reporting menu (icon in the navigation bar accessible to Designers, Architects and Creators) or via the object tree → root folder Reports of the current repository
-
Next, click the report name you wish to view. It may take a few moments to build the report if the report includes many objects.
-
If the report is not displayed, in the right pane, click the REPORT tab
Reports are refreshed anytime you:
-
Click a report name
-
Refresh your browser window
-
Modify the report view as described below
Modify your report view
In Generic List or Table and Text Search reports, use the quick sort buttons and filter fields to modify a report display. These options modify your report view and do not modify the view seen by others.
For example, the screenshots below show a report sorted in reverse alphabetical order (middle column) and filtered by a specific responsible resource (right column):
|
Original Report |
Reverse Alphabetical by Object Name |
Only "Sales" Responsible |
|---|---|---|
|
A report of Processes and their Responsible Resource:
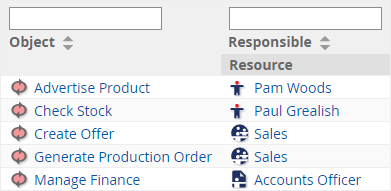
|
Clicking the "Object" down arrow displays the report
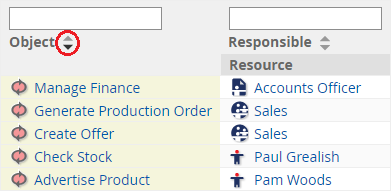
Clicking the up arrow will sort alphabetically. |
Typing "Sales" as the Responsible Resource
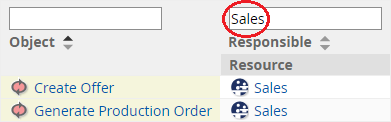
|
In Generic Matrix, Text Search and Risk Map reports, View Options are available to modify the report.
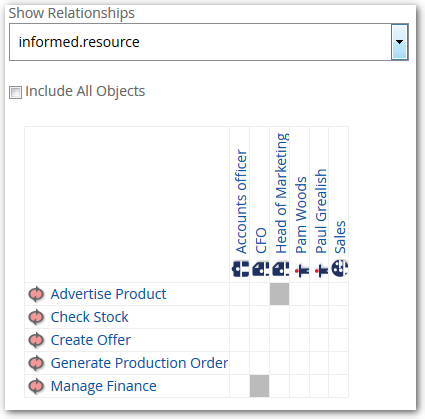
For example, the screenshots below show a report filtered to display one relationship:
|
Original Report |
Report showing only "Informed" Resource Relationships |
|---|---|
|
A Generic Matrix report of Processes and related
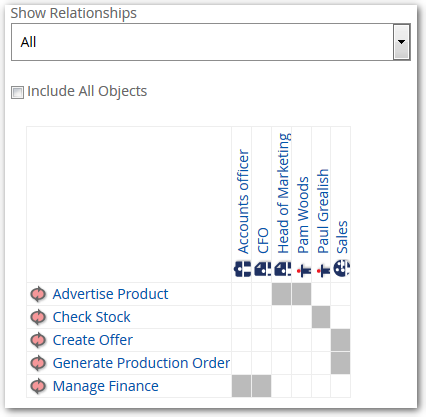
|
Choosing "informed.resource" from the Show Relationships
|
In the above reports, the Report Settings (discussed below) determine which relationships are available in the Show Relationships drop-down.
In all reports except Risk Maps, Matrix Reports and Narrative Templates, advanced sorting is available by clicking SORT BY. In the dialog, specify the column for first level sorting and then add additional levels of sorting as desired. For text columns, the Smallest to Largest Order displays in alphabetical order.
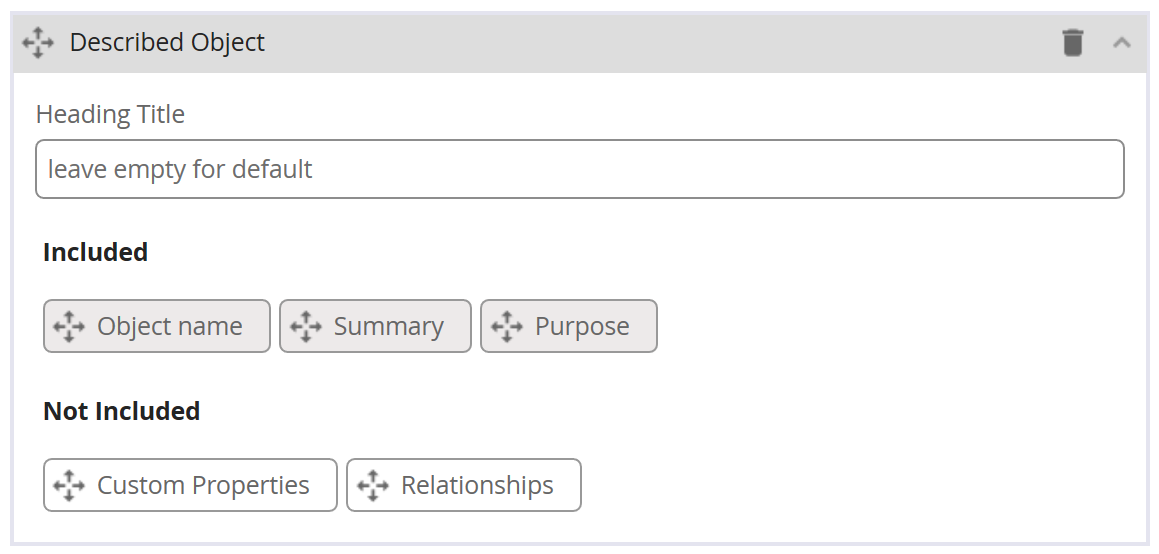
In Narrative Templates, the Report Settings determine which sections appear in the report, what the sections contain, and the order of the sections. More details: Narrative Reports
Rename, Delete, Move, or Copy a Report
-
Right-click a repository object and choose the desired command from the context menu
-
Complete the dialog and finish the operation (e.g. click CONFIRM SELECTION)
Create a Report
From the repository tree:
-
Click the Reports root folder of the current repository or a child Report Folder to highlight it
-
Click ADD Object at the top of the repository tree
-
In the Select drop-down, click Report
-
Type a Name
-
Set additional options as desired
-
Click FINISH
Depending on the report type, a report might not be displayed until settings are defined.
-
In the right frame, click the SETTINGS tab
-
Choose a Report Type (see the top of this page for descriptions)
-
Define the Filter and Properties using the iGrafx Query Language
-
To limit report results to the approved versions of objects, choose Approved Version. To report on the latest versions only, choose Latest Version.
-
Click PREVIEW REPORT or click the REPORT tab
-
To initialize a column sort order, click the down or up arrow in a column heading as shown below. Users who later view the report can change the sorting if desired.
Reports can also be created in the Reporting Area:
-
Use the left side navigation bar → Reporting
-
Click DESIGN REPORT in the bottom right corner
-
Complete the dialog to specify the report configuration
-
Click SAVE REPORT and complete the dialog
Modify a Report
To modify settings in a saved report, do the following:
-
Select the report name in the repository tree
-
In the right frame, modify the report in the SETTINGS, DETAILS, and RELATIONSHIPS tabs
-
Click PREVIEW REPORT (SETTINGS tab) or click the REPORT tab to verify your changes
Export a Report to Excel (Download Data)
To export from a Generic List or Table, Generic Matrix, or Text Search report:
-
Select the report name in the repository tree
-
If the report is not displayed, in the right pane, click the REPORT tab
-
Below the report, on the far right, click DOWNLOAD DATA
-
Depending on your browser used, open the .xlsx file from your Downloads folder
Report Components and Query Language
You can create reports using filter, property, and relationship strings that define a report's content. While powerful, using the iGrafx Query Language is an advanced feature. Here are some details to help you get started.
Report Components
A report is composed of three elements:
-
The settings that specify the data the report will produce
-
The output that is shown to the user when the report is displayed
-
The view options that are available when looking at the report output
Report Settings
The report type specifies the report layout, behavior, view options, and structure, which serves as a starting point for specifying report settings. See the top of this page for descriptions.
Additional report settings are specific to the type selected, and are composed of fields for filtering the objects of interest and fields that specify what will appear in the report. For example, in a Generic List or Table report, there is a Filter field that specifies which objects will appear in the first column of the report, and a Properties field that lists the properties of those objects that will appear as additional columns in the report. Both of these types of fields employ the iGrafx Query Language to allow you to precisely specify what you want to see in the report output.
Report Output
Based on the report type, the report will output a set of objects and corresponding property values of those objects. Objects listed in the report output are hyperlinks to their object definitions in the repository. The content of the report output is subject to the permissions of the user viewing the report. For example, if you view a report and do not have rights to some objects that would otherwise be included in the report, those objects are automatically culled from the objects included in the report.
View Options
You may be able to vary the report output if there are view options available in the report type used. These view options are not part of the report settings, so they are available to everyone.
iGrafx Query Language (IQL)
The iGrafx Query Language lets you specify how the report should return enterprise objects, diagram objects, and their corresponding data. Those fields that allow the use of query strings assist you in creating them by displaying drop-down lists of possible elements, based on context, as you type, which you can select with a mouse click or by using the arrow keys. This feature can be very helpful, especially since the query language is case sensitive. For elements selected from these lists, the case is automatically correct.
Initially, there are two types of query language fields: Filter, Properties, and Relationships.
Filter Field
A Filter field is used to specify the objects from the repository that will be included in a certain dimension of the report (based on the report type). For example, in a Generic List or Table report, the Filter field determines which objects are listed in the first column. If you enter nothing into a Filter field, then all objects in the repository have been "selected" for that dimension of the report. So specifying a Filter narrows the report's focus to only those objects of interest for the report being defined. To this end, you can:
-
Filter by using a relationship that may only exist on certain objects (such as, show me only those objects that have a resource Responsible for them).
-
Filter by using a property with a certain value that may only exist on certain objects (such as, show me only those objects that have a Requirement Type equal to "Business". One of these properties is the type of the object, which means that you can directly filter objects based on type (show me only Process objects).
-
Phrases can be connected by "and" and "or" or prefaced by "not". Use "(" and ")" to explicitly control the grouping and order of phrase execution.
-
Phrases relating to testing the same object for different values should be connected by using "in" or "not in" instead of by a string of "and" and "or" statements. The "in" and "not in" operator is considerably more efficient. The operator should be followed by a list of comma separated values surrounded by parenthesis. e.g. not in (value1, value2, value3)
-
-
Phrases can be compared in a number of ways:
-
Non existence (use "not" prior to property or relationship to represent no value exists)
-
String Exact compare ("=" "<>")
-
Like or Substring String compare ("~")
-
Wild card single character ("?")
-
Wild card any characters ("*")
-
Escape wild card ("\")
-
-
Number compare ("<", "<=", ">", ">=", "=", "<>")
-
Fixed List of Enumerations value compare ("=", "<>")
-
Date/Time and Date compare
-
(DateProp "<, <=, >, >=, =, <>" yyyy-mm-ddThh:mm:ss) Time is optional. If you do provide time, seconds are optional. Hours are always in 24-hour format. Examples of date and time literals:
-
2017-05-15
-
2017-05-15T17:15
-
2017-05-15T17:15:30
-
-
Now Offset compare (DateProp "<, <=, >, >=, =, <>" +-Ny/m/w/d/h where DateProp is one of many possible properties of Date/Time, N is a number, and the letter represents the time unit which provides a +- time offset from now to compare to the date property)
-
-
Be aware that the "Boolean" custom property value type can have any of three states, 'true', 'false', and 'does not exist'. Because of this filter expressions will behave in unexpected ways if you don't explicitly compare to 'true' or 'false'. A filter expression of "custom:IsImportant" is NOT the same as "custom:IsImportant = true"
Properties and Relationships Fields
The Properties (Generic List and Table, and Text Search reports) and Relationships (in Generic Matrix reports) fields specify information to be shown in the report about those objects selected using Filter fields. For example, in a Generic Matrix report, you can specify a list of relationships that, if existing between objects in the rows and columns, will color the intersecting cells gray. When specifying a list of properties or relationships, you can use commas or spaces to separate list entries.
Note that, based on the report type, the report output might include additional information beyond that which you specified in the Properties or Relationships field to add context and aid in comprehension by consumers of the report data. For example, in a Generic List or Table report, specifying nothing in the Properties list field will still generate report output showing the objects selected from the Filter field in the first column.
The set of fields that available in a report depends on the report type.
In Generic List or Table and Text Search reports:
-
The Filter field defines objects to be listed in first column.
-
The Properties field lists properties of interest to be included as other columns.
-
The Approved Version option lets you limit the report results to objects that are approved. To report on the latest versions only, choose Latest Version. See Report Results above
In Generic Matrix reports:
-
The Row Filter field defines the objects to be included in the report's rows.
-
The Column Filter field defines the objects to be included in the report's columns.
-
The Relationships field list relationships that, if existing between objects in the columns and rows, will color the intersecting cells gray.
-
View Options controls are available in the report. If there are multiple relationships specified in the Relationships list field, you can set the Show Relationships drop-down list to "all" or limit the intersections to one of the relationships listed. You can select the Include All Objects check box to list all objects returned; otherwise, the report will include only those rows and columns with intersection points (relationships).
In Risk Map reports:
-
An Impact vs. Likelihood map is created for all included objects.
-
Objects defined by the Filter field will be included only if they have Risks for which the Use Impact and Likelihood check box is enabled.
iGrafx Query Language Usage and Naming Conventions
There are three types of element construct in the iGrafx Query Language, which are composed of multiple words concatenated together with no spaces. These three types can be described as follows:
-
The Relationship construct describes a relationship between objects, and has a naming convention of lower case first word, and an initial capital for subsequent, concatenated words). Example: "isDocumentedBy". See Relationships for a list of values.
-
The Property construct describes a property an object may have, and has the same naming convention as the Relationship construct. This construct can also include custom properties defined in the repository, which are prefixed with "custom:". Examples: "createDate", "custom:kpiCategory". See Properties for a list of values.
-
The Type construct is used as a prefix to refer to a built-in enumeration value, and has a naming convention of an initial capital letter on all words. Example: "RequirementType". The type values are in all capital letters. See Types for a list of types their values.
When creating a query phrase, all of the above elements may be used in combination by joining them with a period (".").
To refer to a built-in enumeration value, use the Type construct as a prefix. Here's an example that uses a Property (an object’s "type"), a Type ("ObjectType"), and a built-in enumeration value ("PROCESS"):
"type = ObjectType.PROCESS"
If the above is used as a Filter, it will return only objects of type Process in a report.
See Also