19.15.0 Cloud Release Highlights
Reporting - Diagram creation source
A new IQL property, creationSource, has been added to allow reporting on how a diagram was created — for example, from a template, Quickmaps, Pia, or via Visio, IGX import. This enables champions of the iGrafx app to gain insights into content creation patterns and adoption of specific features.
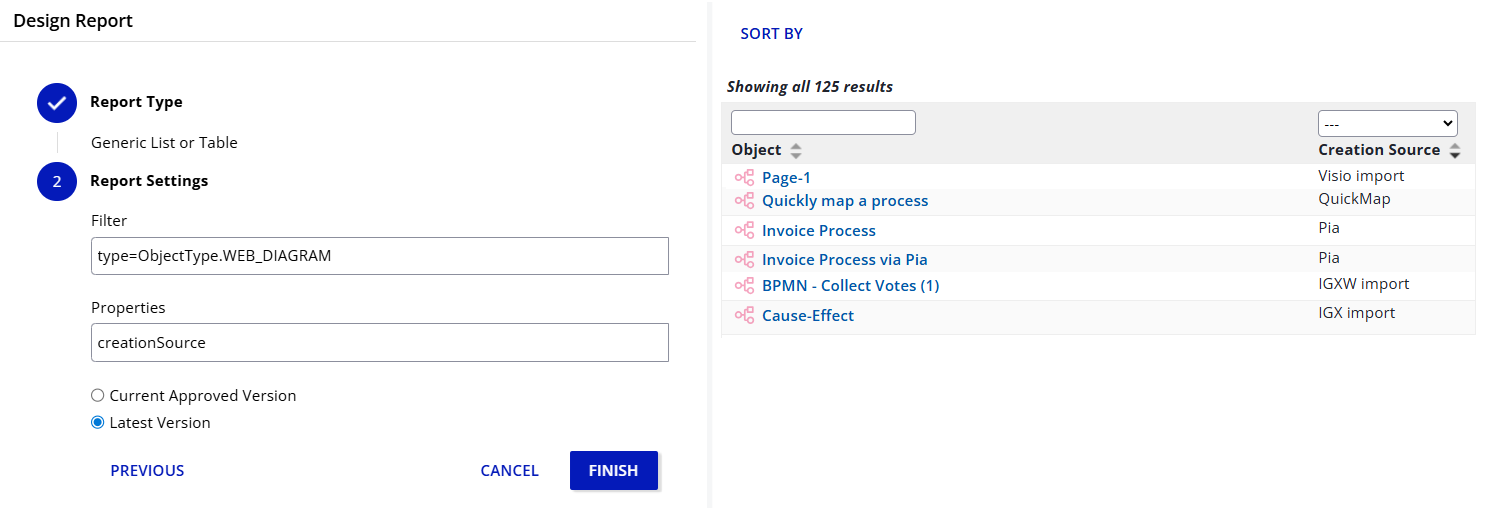
All Reporting properties can be found: IQL query properties
Reporting - Downloaded report with descriptive name
When downloading reports, the file is now automatically named after the report itself, so users no longer need to rename it manually. The feature handles special and non-ASCII characters (e.g., Japanese, Chinese) gracefully. If the report does not have a name, the system falls back to naming the downloaded file based on the report type as it did before. Any unallowed characters are replaced with “_”.
Read more: Reporting
Cycle Log - Track initial and changed reminder settings
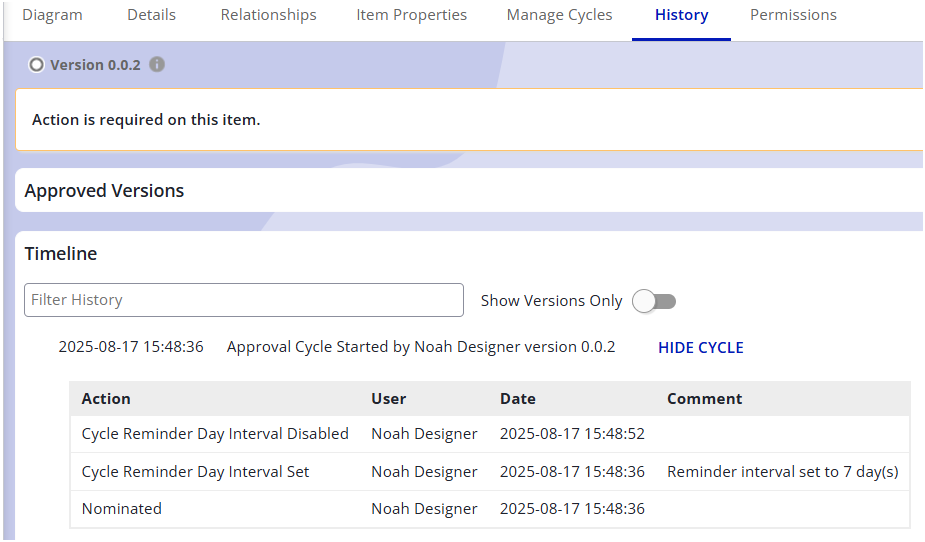
Reminder settings are now clearly tracked in the cycle logs. When a cycle starts, the active reminder configuration is recorded in the log entry. If reminder intervals are changed during a running cycle, a new log entry of type Cycle Settings Change is added, showing the new value. Two new cycle events were introduced — Reminder Disabled and Reminder Set — ensuring that changes are visible across cycles, history, and reporting.
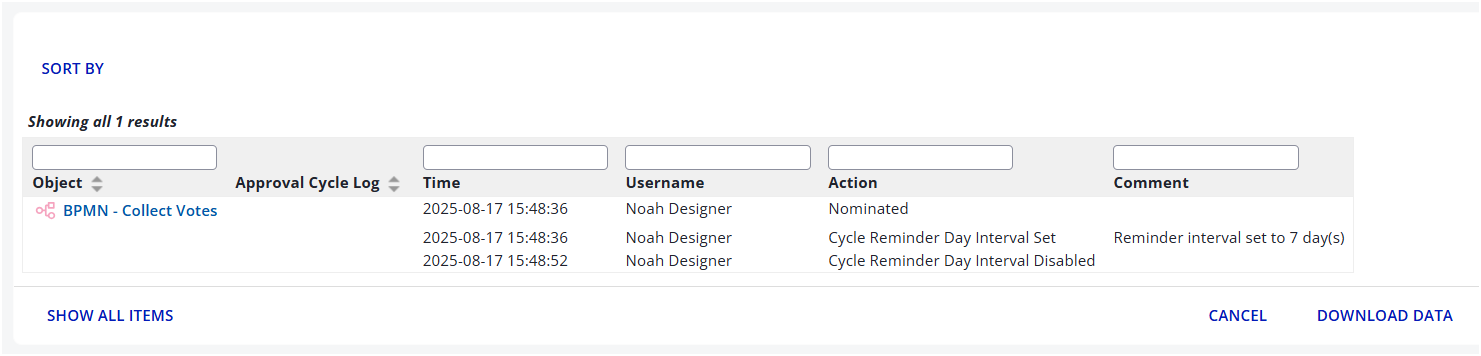
The cycle log is available as reporting property as well:
Narrative - Shape List Section in Table View
We have removed the seven item limit for the Table view of the shape list section. The number of items that can be displayed is now unlimited, allowing for more comprehensive content display.
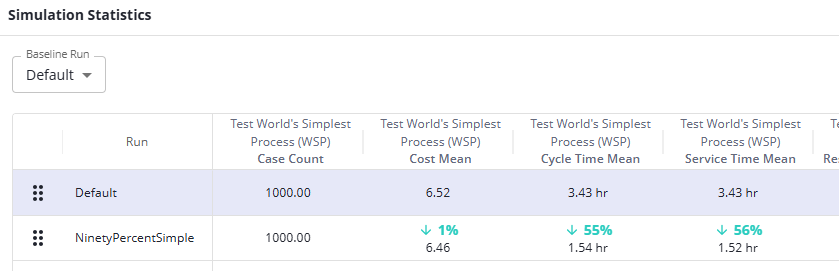
Simulation - Run All Scenarios
There is now a capability to run all Scenarios, to run multiple experiments automatically based on running each Scenario once.
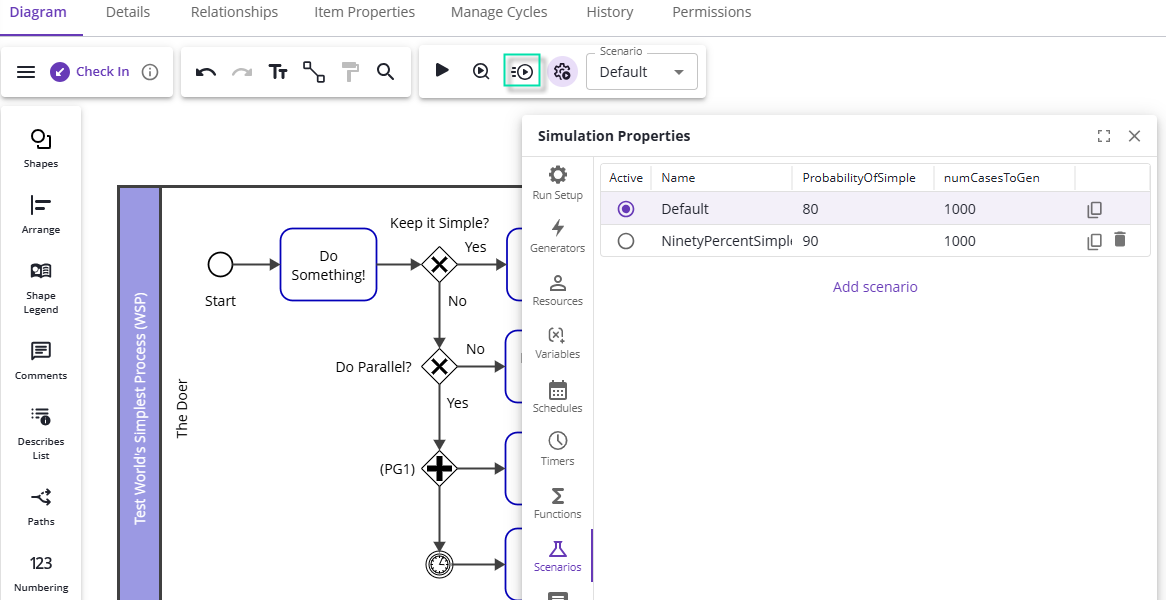
Simply set up your Scenarios to set the value of Scenario variables for each simulation you want to run. In the example shown above, the ‘ProbabilityOfSimple’ Scenario variable controls the behavior of the ‘Keep it Simple?’ Gateway shown; a ‘PercentTrue’ function call ensures the number given by the ‘ProbabilityOfSimple’ Scenario variable results in approximately that percentage of cases following the Yes path. Running all Scenarios will set the ‘ProbabilityOfSimple’ Scenario variable to ‘80’ on the first simulation run, and to ‘90’ on the second run, saving the results of each run to the Project:
As a reminder, Scenarios allow quickly switching between sets of Scenario variables, to run experiments quickly based on the scenario variables you’ve created. To learn more about Scenarios and Scenario variables, see our Scenarios Documentation
Early Access
Early Access features require your system administrator to enable them for your entire organization. How to enable Early Access features
ICS Risk Data Table
The ICS risk data table has been updated to a more compact and data-driven view. Column and row labels now include title hovers for long names