Introduction
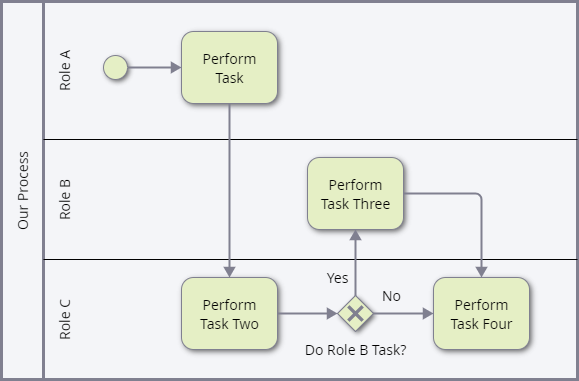
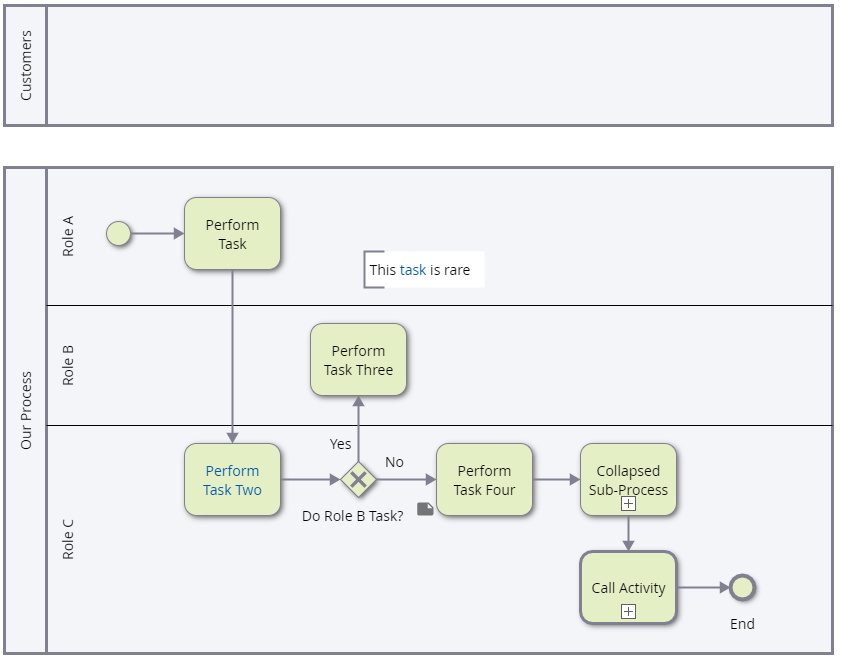
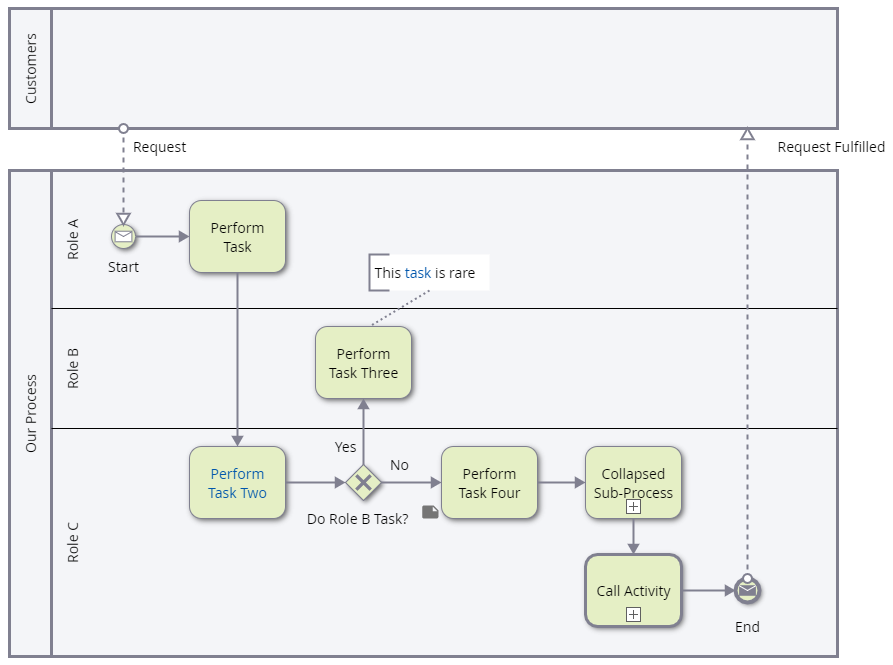
In this tutorial, you will learn how to create and edit web BPMN diagrams like the diagram below:
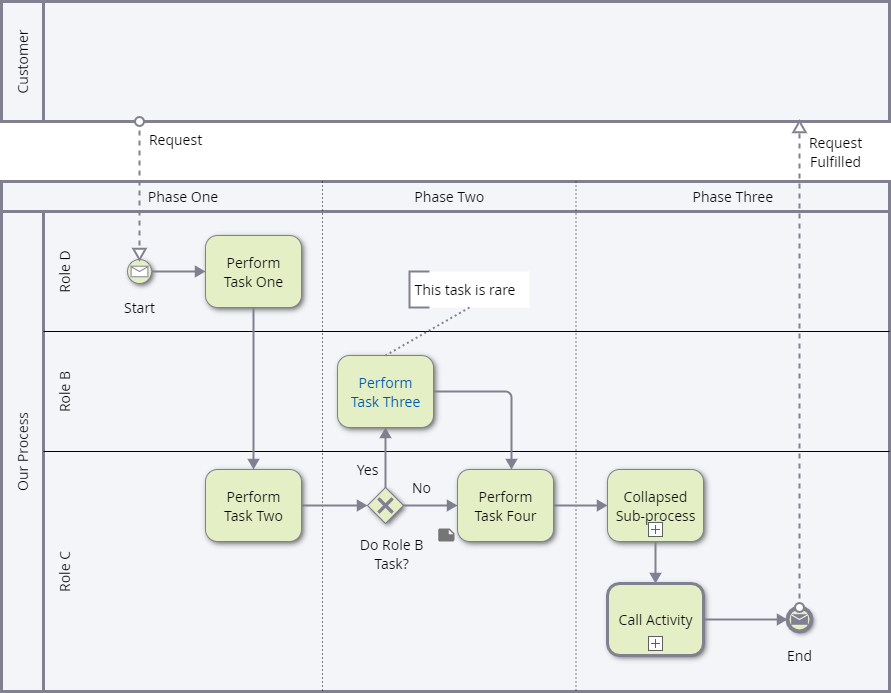
Some of the BPMN concepts used in the diagram above are:
-
Pools (e.g., Customer, Our Process)
-
Lanes (e.g., Role A, Role B, Role C)
-
Message Events (e.g., Message Send, Message Receive)
-
Messages (e.g., Request, Request Fulfilled)
-
Phases
-
Exclusive Gateway (decision)
-
Collapsed Sub-Process shape
-
Call Activity shape
-
Free-form Text (e.g., "This task is rare") that is connected to a Generic Task shape
-
Task shape with a Note indicator (e.g., Perform Task 4)
Click the link below to watch a 23 minute web diagramming video demonstration:
A Designer, or Architect license is required to create web diagrams (or equivalent User Extensions).
Creating a new BPMN Web Diagram
-
In the iGrafx Platform, Model area, click a Document folder name (to highlight it) where you want to add a diagram
-
Click ADD OBJECT at the top of the repository tree
-
In the Select drop-down, choose Diagram
-
Choose the diagram type you wish to create (for this portion of the training choose Blank BPMN Diagram)
-
Type a Name
-
Set the Summary and Watch this object as desired
-
Leave Create Another unchecked
-
Specify the initial version number for this new diagram
-
Click FINISH
A blank diagram and shape palette is displayed in the right frame:
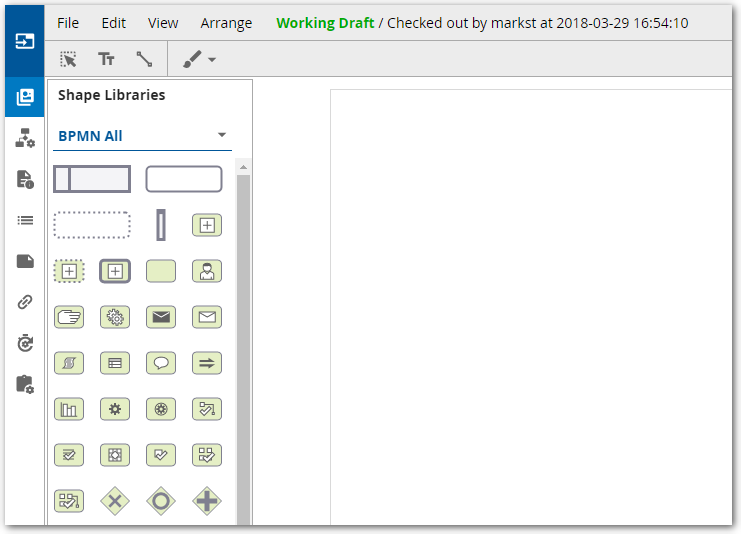
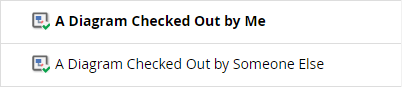
The repository tree displays a check mark on the icon 
When an item is checked out by you, the name of the item (diagram) is also shown in bold text (which is more visible when the item itself is not currently highlighted):
A web diagram can only be modified when it is Checked Out.
Available shapes, pools, and other diagram elements are displayed BPMN ALL Shape Library.
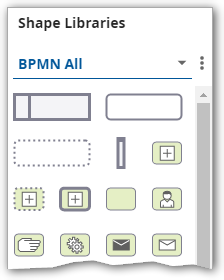
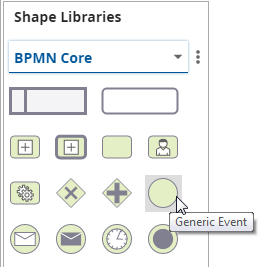
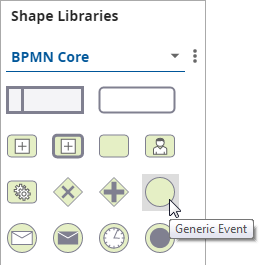
Display an alternative shape library with fewer shapes:
-
Click the arrow

-
Choose BPMN Core
To make additional shape libraries available:
-
Click MANAGE LIBRARIES at the bottom of the shape library
-
Select the additional libraries you want available in the drop-down
-
Click UPDATE
if desired, your repository administrator can create custom shape libraries
To hide and display the Shape Library:
-
Click the highlighted Shape Libraries icon

-
Click the Shape Libraries icon

The Shape Libraries icon is only accessible when a diagram is checked out.
Adding Pools and Lanes
Add a Pool to your diagram:
-
In the Shape Library, click down on the Pool object

-
Drag the cursor to the diagramming canvas
-
Release the left-mouse button in a location where the whole Pool will be visible
-
Click the Pool header (see below) and then type "Our Process"
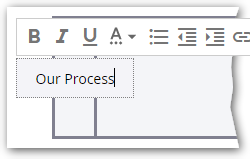
-
Click outside the edit box when done.
Label Pools with participant (e.g. business unit), process names or resource names.
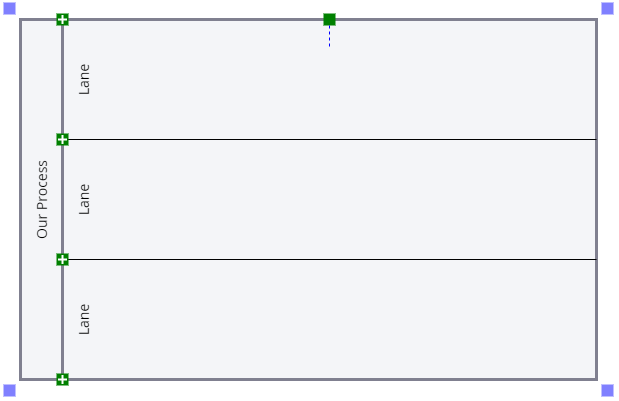
Add Lanes to the Pool:
-
Click the Pool header area
-
At the bottom of the header, click the Add Lane icon

Your diagram should look like this:
Label the Lanes:
-
Click the top Lane header to highlight it
-
Type "Role A"
-
Click outside the edit box
-
Label the other Lanes "Role B" and "Role C"
Using Hints to Describe Enterprise Objects
As you type diagram labels for lanes, shapes and text, iGrafx does a typeahead (autosuggest) search to match the typed text with an existing repository object.
For example, if your repository Resources folder contains three Organization objects as shown below:
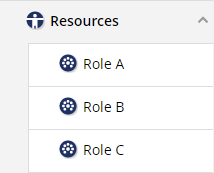
After typing the first two characters of "Role" in the Lane header, the repository icon appears:
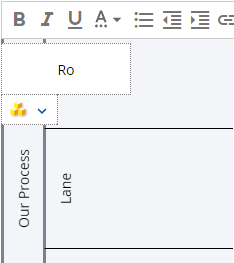
Clicking the Repository drop-down arrow displays Hints:
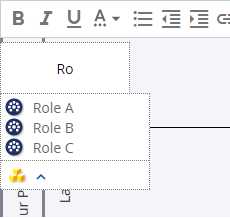
Clicking a Resource (e.g. "Role A") labels the Lane and associates it with the repository Resource. Later, if the repository Resource is renamed, the diagram swimlane is automatically updated. In addition, the lane is displayed with a Resource icon 
If there are no matching resource objects, then the repository icon will not appear and your Lane label will be whatever text you entered.
See the Resource topic for instructions on how to add Resources to the repository.
Adding Generic Events and Task Shapes
Add the Generic Event shape:
-
In the Shape Library, click down on the "Generic Event" shape and keep your left mouse button down
-
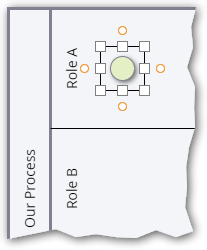
Drag the cursor to the "Role A" lane, just right of the text
-
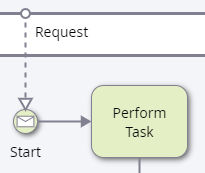
Release the left-mouse button. The diagram should look similar to this:
Place an Event (circle) shape at the beginning and end of a BPMN flow.
Add the Generic Task shape
-
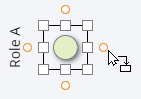
Click the circle icon on the right face:
-
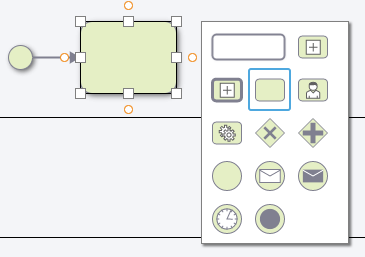
A new "Generic Task" shape and connection line are added. In addition, you can change the shape added by clicking in the shape library pop-up to the right of the shape:
-
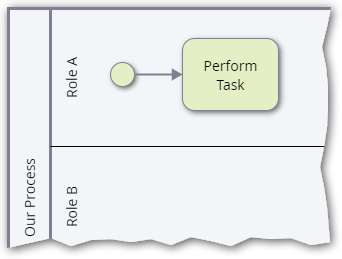
With the new shape still highlighted, type "Perform Task"
-
Click outside the edit box
The diagram should look like this:
Label "Task" shapes with "Verb Noun" text phrases.
Add another shape via Drag and Drop
-
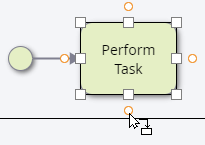
Click the "Perform Task" shape
-
Click down on the lower circle dot and keep your left mouse button down
-
Drag the cursor down past the "Role B" lane to the "Role C" lane
-
Release the left-mouse button
-
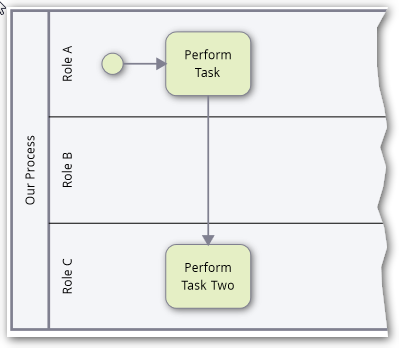
With the new shape highlighted, type "Perform Task Two"
-
Click outside the edit box
-
The diagram should look similar to this:
Moving Shapes
You can move web diagram shapes via drag-and-drop or by using your arrow keys.
To move a shape via drag and drop:
-
Click down on the "Perform Task" shape and keep your left mouse button down
-
Drag the cursor in any direction
-
Release the left-mouse button
To move a shape via arrow key
-
Click a shape to highlight it
-
Press any arrow key
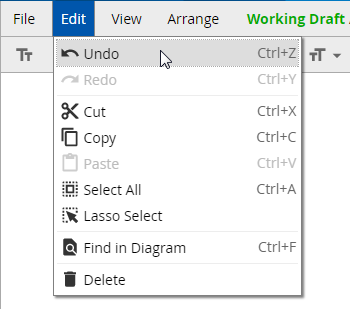
Undo
To undo moves or other actions, type CTRL-Z or use the Edit > Undo menu option:
Adding Gateway Shapes
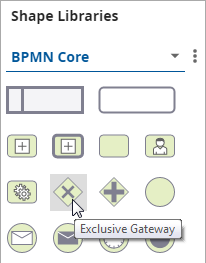
Gateways control how process flows split and merge. If the flow does not need to be controlled, then a Gateway is unnecessary. The Exclusive Gateway (decision) and Parallel Gateway (join) are the two most commonly used Gateways and are available in the "Core" BPMN shape library.
Add an Exclusive Gateway (decision) shape to the diagram:
-
In the Shape Palette, click down on the "Exclusive Gateway" shape and keep your left mouse button pressed down
-
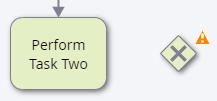
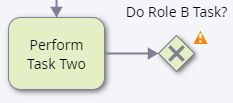
Drag the cursor onto the diagram area and release it such that the selected Gateway is placed on the right-hand side of the "Perform Task Two" shape (as shown below):
-
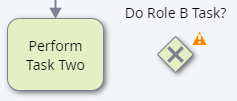
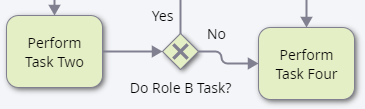
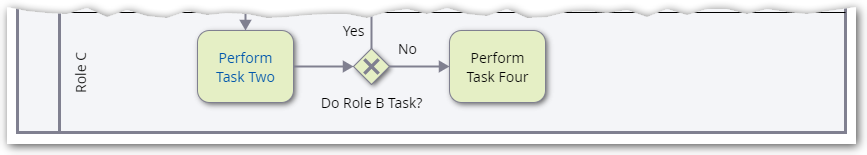
If not highlighted, click the Gateway to select it, type "Do Role B Task?" and click outside the edit box. The diagram should look similar to this:
Connect the "Perform Task Two" shape to the Gateway:
-
Click "Perform Task Two" task shape
-
Click the yellow circle dot on the right face
-
Click outside the highlighted line
-
The diagram should look similar to this:
Gateway Warning Messages
To maintain conformance with the BPMN standard, warning icons 
-
Click the warning icon
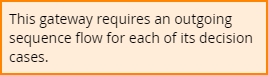
The following message is displayed:
-
Click outside the warning to hide the message
The warning message indicates that the Exclusive Gateway is missing at least one sequence flow (line) exiting the shape. To remove the warning, you must draw the necessary sequence flows to account for each "case" that pertains to the Exclusive Gateway.
Moving a Gateway Label
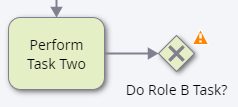
Before adding the Gateway's outgoing sequence flow, move the Gateway label from above to beneath the Gateway. You are doing this because one of the sequence flows will exit the top of the Gateway.
-
Click down on the "Do Role B Task?" label (NOT THE SHAPE) and keep your left mouse button down.
-
Drag the cursor to beneath the Gateway
-
Release the left-mouse button
-
The diagram should look similar to this:
Adding Gateway Sequence Flows
Add the sequence flows that exit the Gateway:
-
Click the Gateway shape
-
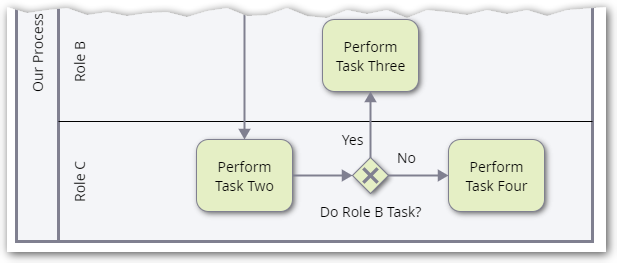
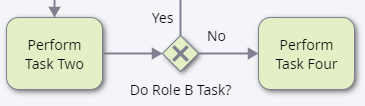
Click the yellow circle dot at the top face of the Gateway. This will automatically draw a sequence flow line (with the Yes option) and Activity shape above.
-
Click the Gateway and click the yellow circle dot at the right face of the Gateway. This will automatically draw a sequence flow line (with the No option) and Activity shape to the right.
Notice that the warning icon disappeared because you have accounted for the two sequence flows from the Gateway.
If you draw a sequence flow line from a Decision Gateway shape and then notice that the flow line displays the 'wrong' Gateway option (e.g., it shows "No" but you want it to show "Yes"), all you have to do is select the sequence flow line (i.e., to highlight it) and then press your space bar. Pressing the space bar while a Gateway sequence flow line is highlighted, toggles through all the available options configured for the Gateway. Once the desired case text is displayed, you can move on.
Adjust and Label the New Shapes:
-
If necessary, move the shape in the "Role B" lane so that it lies entirely within the lane
-
Label the new shapes "Perform Task Three" and "Perform Task Four" as shown below:
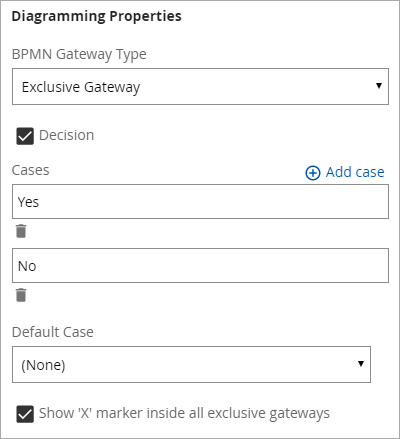
Changing or Adding "Cases" on Exclusive Gateways
View the Exclusive Gateways properties:
-
Click the Gateway shape to highlight it
-
On the left frame, click the Diagramming Properties button

-
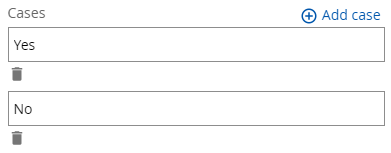
Under the "Cases" section, note that the "Yes" and "No" text can be modified as desired:
-
To create additional cases (e.g., you are creating a Gateway with three exit paths), click Add case
-
Click the Diagramming Properties button

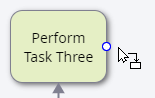
Using the Add lines Tool
Connect two diagram shapes:
-
In the Menu bar, click the Add lines button:

-
Place your cursor in the middle of the right face of the "Perform Task Three" shape:
-
Left-click down and keep the left mouse button down
-
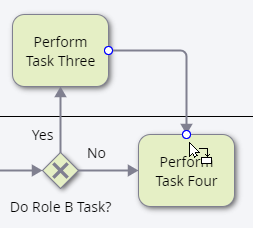
Drag the cursor to the top of the "Perform Task Four" shape as shown:
-
Release the left-mouse button
-
Click the Add Lines button

-
The diagram should look similar to this:
Selecting Multiple Shapes
When editing a diagram, you may need to select multiple diagram shapes for moving, deleting, or aligning purposes.
Before using the Select Tool, you will move a shape out of alignment and later use the Arrange command to align three shapes:
-
Click the "Perform Task Four" shape
-
Press the down arrow key twice so the diagram looks similar to this:
-
In the Menu bar, click click the Lasso Select button:

-
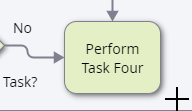
Place the cursor below and right of the "Perform Task 4" shape:
-
Left-click down and keep the left mouse button down
-
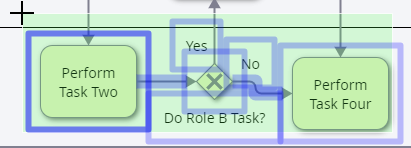
Drag the cursor above and left of "Perform Task Two" to highlight ("lasso select") shapes as shown below:
-
Release the left-mouse button
-
If you missed a shape, then hold the shift key down and click the missed shape to add it to the selection
Leave the shapes selected and proceed to the next section.
Arranging and Aligning Shapes
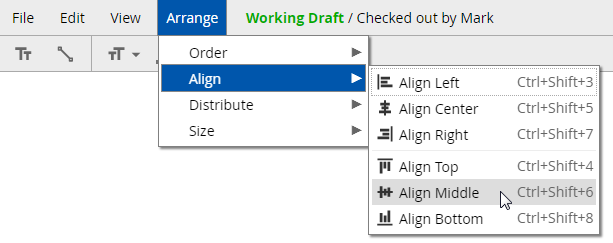
Arrange the previously-selected shapes so that they align (horizontally) with respect to the middle of the 3 selected shapes:
-
From the menu bar, click Arrange, then click Align, and then click Align Middle:
-
Click outside the selected region to unselect
-
The "Perform Task Four" shape is aligned again with the other two shapes in the swimlane:
Artifacts
Artifacts provide additional information about the process to help explain and document the flow. They do not influence the sequence flow. iGrafx supports the standard BPMN artifact types:
-
Text
-
Group (available in the "BPMN All" Shape Library)
In addition, iGrafx extends these artifacts with the following capabilities:
-
Note
-
Comment
Adding Text
Add free-form text to your diagram:
-
In the menu bar, click the Add Text button (circled below the menu bar):

-
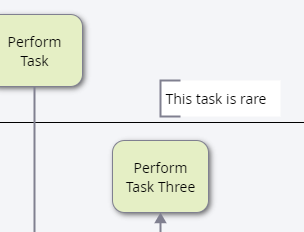
Click the diagram above the "Perform Task 3" shape
-
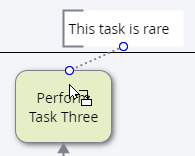
Type "This task is rare" then click outside the edit box. The diagram should look like this:
Connecting Text to a Shape via a Line
Draw a connecting line from your free-form text to a shape:
-
Click the Add lines tool button

-
Place your cursor at the bottom middle of the "This task is rare" text:
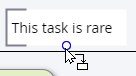
-
Left-click down and keep the left mouse button down
-
Drag the cursor to the top of the "Perform Task Three" shape as shown:
-
Release the left-mouse button
-
Click the Add lines tool button

-
Click anywhere to unselect the connecting line
-
The diagram now contains two line styles:
-
-
Solid lines denoting sequence flow
-
Dotted lines denoting a text artifact associated to a shape
-
Adding a Note
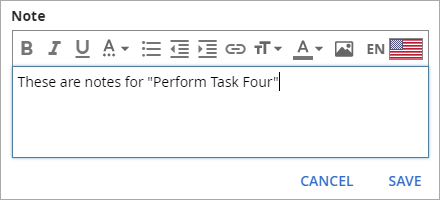
Notes are an effective tool for adding supplemental documentation (e.g. detailed instructions, methods and procedures, etc.) to a shape.
Add a note:
-
Click the "Perform Task Four" shape to highlight it
-
Click the Note tool button

-
Type the note shown below:
-
Click the Note icon

-
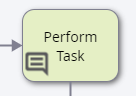
A Note indicator is now displayed on the bottom left hand side of the shape:

Displaying a Note and Closing the Note Dialog Box
View Note text:
-
Click the Note indicator icon next to the "Perform Task Four" shape
-
Click the Note Tool button
Adding a Comment
Comments can be added to diagrams at any time but they are particularly useful during Review Cycles when users want to make annotations at a specific diagram location.
It is possible to give users Comment permissions without diagram modify permission. See iGrafx Roles and Permissions documentation for additional details.
Add a comment:
-
Click the Add Comments tool button (on the right side of menu bar):

-
Move the cursor over the "Perform Task" shape
-
Click the shape
-
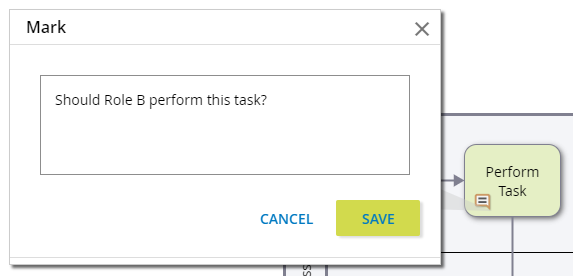
In the Comment dialog, type "Should Role B perform this task?"
-
Click SAVE
-
Click the X in the dialog to close it
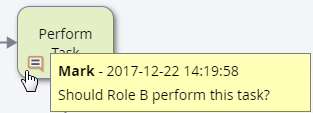
View a comment:
-
To view the Comment, hover the cursor over the Comment indicator:
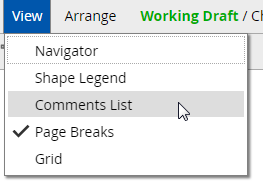
View all Comments in a window:
-
From the menu bar, click View, then click Comments List:
-
Click the X in the Comments List window to close it
Delete a Comment:
-
Click the Comment indicator to open the Comment dialog
-
Click DELETE
Adding a Shape Field (e.g. RACI Responsible)
Shape Fields display information about an object (often a Process or Activity) Described by a diagram shape. To display a Field, a shape must first Describe an Object.
First, create a Process object which the shape will Describe:
An Architect license (or equivalent User Extensions) is required to create Process objects. However, later steps can also use an existing Process object if you can't create one.
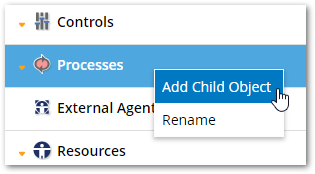
-
Right-click the Processes folder (or a sub-folder of Processes) and choose Add Child Object:
-
In the Select drop-down, choose Process
-
In the Name field, type "Advertise Product"
-
In the right frame, choose the Relationships tab
-
If not expanded, expand Incoming Relationships
-
Click the Add button

-
Choose any Resource object in your repository (e.g. "Marketing Agent")
-
Click Finish
In your diagram:
-
Click the "Perform Task Two" shape to select it
-
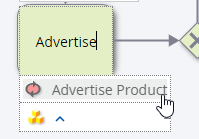
Type "Advertise"
-
From the drop-down displayed under the shape (see below) choose Advertise Product:
-
If Advertise Product is not displayed, then first click the Display Hints drop-down

The Describe dialog is displayed:
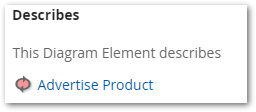
-
Close the Describes dialog by clicking the Describes icon

-
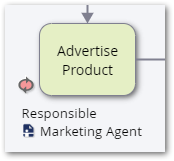
With the shape still selected, in the left frame, click the Fields icon

-
In the Display Fields dialog, choose Responsible
-
Click the Fields icon again (to close the dialog)
The Field is displayed below the shape:
If desired, you can drag and drop the Responsible Field to a new location
Adding a Repository Link
In addition to artifacts, supplemental process documentation might be found in your repository, the company intranet, or the web. You can link to other documents from most diagram text objects (including all or a portion of a shape label).
See Adding non-iGrafx (External) Files to a Repository for instructions for adding supporting documents to a repository.
Link a shape to a repository file:
-
Right-click "Perform Task Two" and choose Add Link to Shape
-
In the Link to setting, leave Repository Object selected
-
Click CONTINUE
-
In the Path field, type the (partial) name of any Word document stored in your repository. For the purpose of this example, there is already a repository document named "Perform Task Two Instructions.docx". In that case, you can start typing a partial name, as shown below:
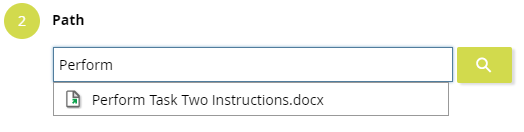
-
As you type, the dialog will display any existing repository items whose name contains the string that you've typed
-
Click a document
-
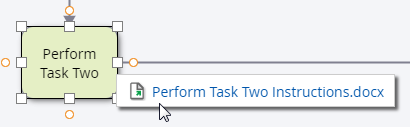
For example, if "Perform Task Two Instructions.docx" is clicked then the Path appears this way:
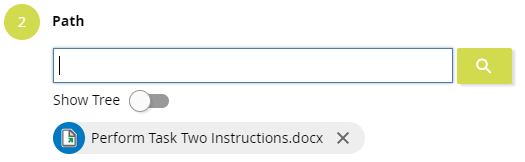
-
Click FINISH
The shape is displayed with a Link icon
Viewing a Linked Repository Item
Follow the link:
-
Click the Link icon next to the "Perform Task Two" shape
-
Click Perform Task Two Instructions.docx
-
Click VIEW FILE
-
To close the viewing pane, click outside it
You can also:
-
Click DOWNLOAD FILE (to access the file in it's authoring tool), then the next dialog varies depending on the browser used
-
Click OPEN OBJECT to navigate to the objects repository location
Adding a Link (e.g. to a Web Page) to Diagram Text
Link diagram text to a web page:
-
Click free-form text "This task is rare" and then click it again to make the link tool

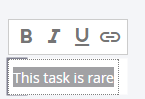
-
Double-click the word "task" so that only that word is highlighted:
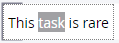
-
Click the Link icon
-
In the URL Path, type "www.dictionary.com/browse/task"
-
Click ADD LINK
-
Click outside the text field
You have linked the diagram word "Task" to a web dictionary definition. Click the word "task" and then click FOLLOW LINK to navigate to the URL.
Repository links can be associated with text and URL links can associated with shapes.
Zooming
Zoom in or out to change your diagram view with two alternative methods:
-
Hold the CTRL key down, then scroll your mouse wheel up or down
OR
-
Click the zoom percentage number on the far right of the menu bar:

-
Type "150" or a desired zoom level
Moving a Pool
Move the Pool a bit to the left:
-
Click down on the "Our Process" Pool header and keep your left mouse button down
-
Drag the cursor left until the Pool header is near the left Toolbar
-
Release the left-mouse button
Growing a Pool
Grow the Pool to make space for additional shapes:
-
Click down on the right edge of the Pool and keep your left mouse button down
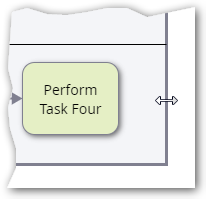
-
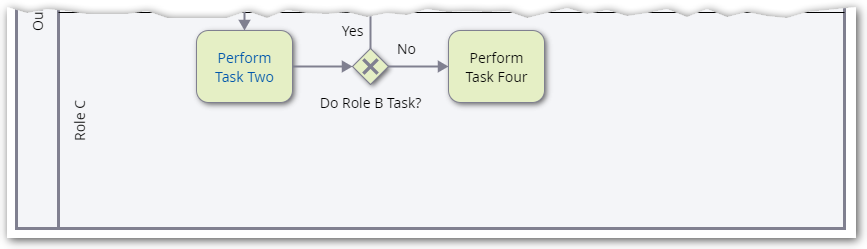
Drag the cursor right until there is room for two additional shapes within the swimlane to the right of "Perform Task Four", as shown below:
-
Release the left-mouse button
-
In the same manner, also grow the Pool downward so that there is room for shapes under "Perform Task Four":
Collapsed Sub-Process Shapes versus Call Activity Shapes
When a process contains multiple levels of detail, shapes can be decomposed to additional diagrams to create a process hierarchy. You can store these diagrams in the same object as the parent diagram or you can store diagrams in their own repository object.
Either way, linking the parent diagram to all applicable child diagrams is important to enable navigation (drill-down) capabilities.
To create a sub-process diagram in the same object as the parent diagram, use the "Collapsed Sub-Process" shape to link the diagrams. To store a linked diagram in a separate object (from its parent), use the "Call Activity" shape to link the diagrams.
"Collapsed Sub-Process" and "Call Activity shapes" can only link to web-authored BPMN diagrams. These shapes cannot link to diagrams within iGrafx Client documents (.igx files).
Adding a Collapsed Sub-Process Shape
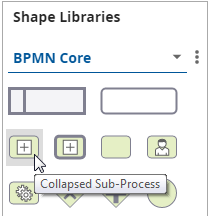
Add a Collapsed Sub-Process shape to the diagram:
-
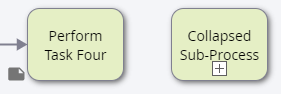
Drag and drop a "Collapsed Sub-Process" shape from the Shape Library to the diagram next to "Perform Task Four"
-
Type "Collapsed Sub-Process" for the shape label
-
Draw a sequence flow line from "Perform Task Four" to "Collapsed Sub-Process".
-
Click the Link

The new diagram is stored in the same object as the parent diagram. It can't be linked to from other shapes in the parent diagram or from shapes in other repository diagrams.
-
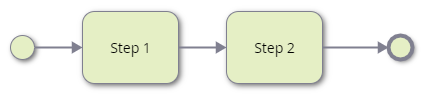
Add the shapes shown below to represent the activities for the sub-process:
-
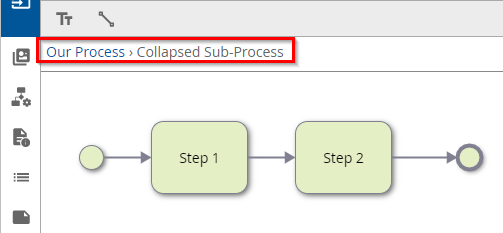
Return to the parent diagram by clicking Our Process in the breadcrumb highlighted below:
Adding a Call Activity Shape
Before performing the steps below, add a new web-authored diagram anywhere in the repository and name it "Call Activity".
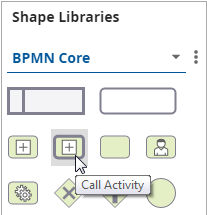
Add a Call Activity shape to the diagram:
-
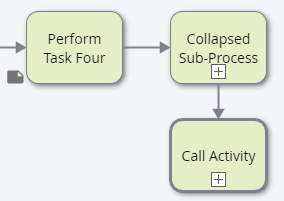
With "Our Process" displayed, drag and drop a "Call Activity" shape from the Shape Library to the diagram directly below the "Sub-Process" shape:
-
Label the new shape "Call Activity".
-
Draw a sequence flow line from the the Sub-Process shape to the Call Activity shape:
-
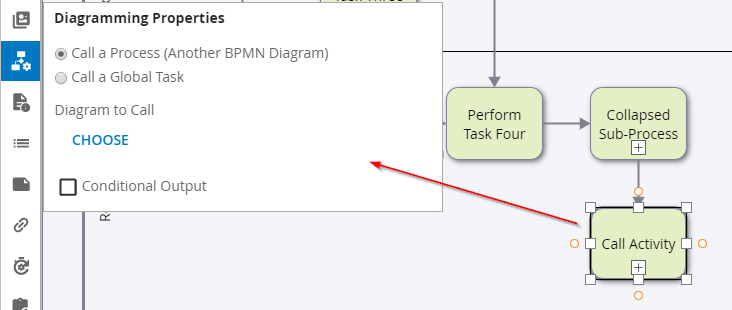
Click the "Call Activity" shape to highlight it and then click the Diagramming Properties icon

-
Leave the Call a Process (Another BPMN Diagram) switch selected
-
Under "Diagram to Call" click CHOOSE
-
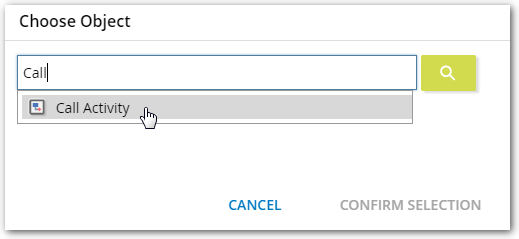
Type "Call" and then click Call Activity from the drop-down:
-
Click CONFIRM SELECTION
-
Close the Diagramming Properties dialog by clicking the button

-
To verify that the link is working, click the Link
The "Call Activity" diagram created earlier is displayed.
-
Click the browser's Back button to return to the "Our Process" diagram.
Adding an End Event
Add an End Event:
-
Drag and drop a "Generic Event" shape from the Shape Library and place it next to the "Call Activity" shape:
-
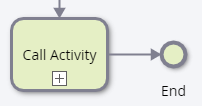
Connect the "Call Activity" shape to the Event and type "End" for the shape label:
-
iGrafx detects the incoming sequence flow to the Event shape and automatically draws a thick border to indicate that it's an "End Event". The label provides additional clarity but is not required.
-
Label the first Event shape "Start".
Adding a Second Pool
Currently, the diagram contains a single Pool named "Our Process". In this section, you will add a second Pool to the diagram, named "Customers".
Use the knowledge you have gained to perform the following steps:
-
Zoom out so that there is space for another Pool above the existing Pool
-
Add the Pool, position it, name it "Customer", and grow it so that your diagram looks similar to this:
Adding a Message Receive Event
Your diagram shows the order that activities are performed in the process. This is the Sequence Flow displayed by solid line connections between shapes.
Next, you will add Message Flows to represent communication with another process participant – the Customers in this example. A Message Flow is drawn with dashed lines. BPMN notation mandates that Sequence Flows cannot cross Pool boundaries and Message Flows cannot connect objects within the same Pool. iGrafx automatically draws the correct line style for you.
Add a Message Flow to represent communication from the "Customer" Pool to the "Our Process" Pool:
-
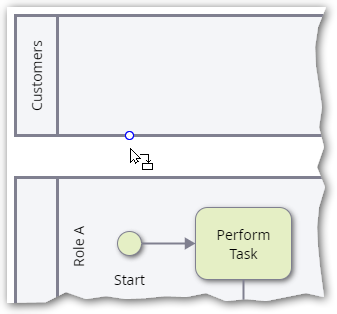
Below the menu bar, click the Add lines tool

-
Left-click down and keep the left mouse button down
-
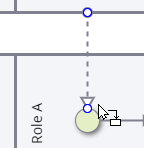
Drag the cursor to the top of "Start" shape as shown:
-
Release the left-mouse button
-
Exit Add Lines mode by clicking the Add lines tool

-
If the line isn't straight, click the line to select it, then drag and drop the "Customer" Pool end point.
-
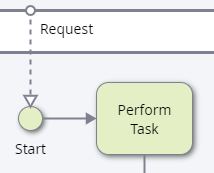
Select the line if it is not selected and type "Request"
-
Click outside the text box
The diagram should look similar to this:
-
Click the "Start" shape to highlight it
-
Click the Diagramming Properties button
-
Change the BPMN Event Type drop-down to Message Receive
The "Start" shape is changed to indicate a "Message Receive" Event:
-
Hide the dialog by clicking the Diagramming Properties button
Adding a Message Send Event
Create a Message Send Event and associated Message line to document the communication from "Our Process" to the Customer.
-
Using the Add lines tool
-
Click the Add lines tool again to return to regular editing mode
-
Click away from the line to unselect the line
-
Click the line to highlight it
-
Type "Request Fulfilled" then click outside the line
-
Move the "Request Fulfilled" label so that it's displayed between the Pools
-
Click the "End" shape to highlight it
-
On the left frame, click the Diagramming Properties icon
-
Change the BPMN Event Type drop-down to Message Send
-
Click the Diagramming Properties button to hide the dialog
-
Your diagram should look similar to this:
When adding text, press the Enter key to make a newline within the text.
Adding Phases (Milestones)
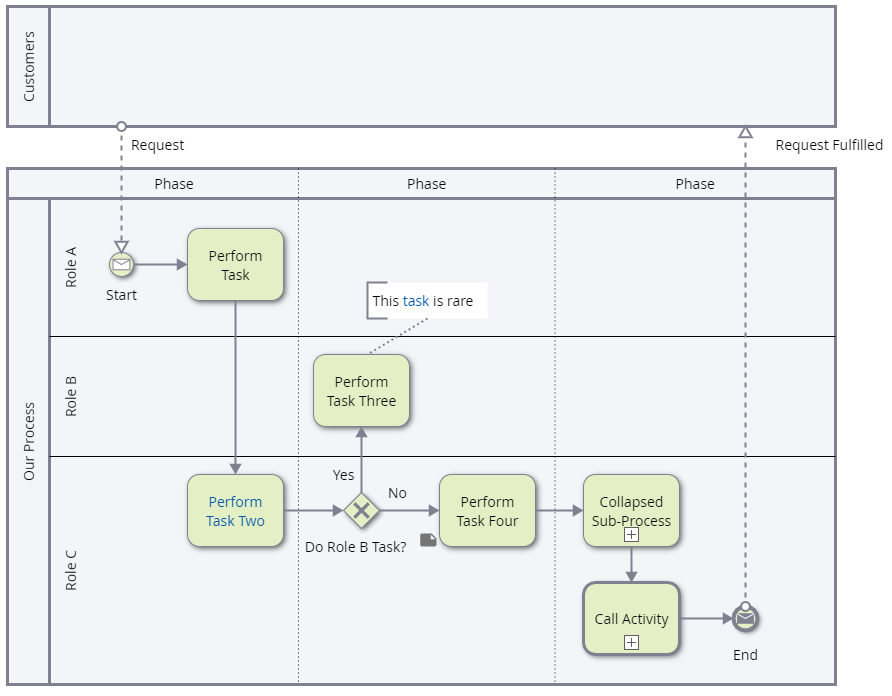
In addition to Pools and Lanes, diagrams can contain Phases that partition a process into groups of activities that represent logical milestones or stages within the process. These partitions can be defined for each Pool in the diagram.
Add three Phases:
-
Click the "Our Process" Pool header to display a phase line indicator

-
Click down on the indicator and keep your left mouse button down
-
Drag the cursor left or right to position the phase border
-
Release the left-mouse button to create two phases
-
Repeat steps 1-4 to add a 3rd Phase to the "Our Process" Pool
-
Your diagram should look similar to this:
Label a Phase:
-
Click the Phase header
-
Type text to specify an appropriate label
-
Click outside the label
There are two methods for moving Phase borders:
-
To move shapes together with the Phase border: Place your cursor over the phase line and then drag and drop to a new location.
-
To leave shapes in place: Hold the shift key down and then drag and drop the phase line to a new location.
To delete a Phase, click the applicable Phase header and press the Delete key or click Edit and then click Delete.
Describes Relationships (and Proposed Describes Relationships)
As documented above in the Adding Pools and Lanes topic, diagram lanes and shapes can Describe enterprise objects. This enables you to visualize the enterprise objects you have defined, and follow relationships from described objects to other objects.
Describes
In addition to using Hints, to create a Describes relationship, or to view an existing Describes relationship:
-
Click a lane header, shape, or text element
-
On the left diagramming frame, click the Describes

Stop here if you only wish to view an existing Describes relationship -
Click CHOOSE OBJECT TO DESCRIBE
-
In the Choose Object dialog, select a repository object
-
Click CONFIRM SELECTION
Proposed Describes
In some scenarios, you may wish to suggest a Describes relationship to an enterprise object that does not yet exist. For example, you might not have permission to create an enterprise object you wish to Describe. In this situation, to propose a new enterprise object and associated Describes relationship:
-
Select one or more lane headers, shapes, or text elements
-
On the left diagramming frame, click the Describes
-
Click PROPOSE NOW
The diagram displays a gray Describes icon indicating a proposed relationship. In other words, the Described object does not yet exist. Later, when finalizing the relationship, you can select the object type (a default is automatically set by the Platform).
Finalize Describes
After proposing a Describes relationship, to create a Described object (and associated Describes relationship):
-
Click a lane header, shape, or text element
-
On the left diagramming frame, click the Describes
-
Click FINALIZE
-
In the Create Proposed Object dialog, choose an object type and location for the enterprise object and click FINISH
Headers and Footers
Add a Header and Footer:
-
From the menu bar, click File, then click Header and Footer (this command is only displayed for checked out diagrams)
-
In the Header section, LEFT tab, type "My Tutorial Process"
-
In the Footer section, RIGHT tab:
-
Type "Current Date: "
-
Click the INSERT drop-down and choose Current Date
-
Press the Enter key and type "Reviewed: "
-
Click the INSERT drop-down, choose Cycle Info and click Reviewed
-
-
Click SAVE
Here is a list of header and footer fields. New fields are added over time so this list might not be complete.
|
Field Name |
Comment |
|---|---|
|
Diagram Name |
|
|
Page Number |
|
|
Page Count |
|
|
Current Date |
|
|
Current Time |
|
|
Version Info > Version |
This is the version numbered displayed by the user interface as defined in the Repository Configuration, Policies area. For example, it may be "0.1.1" |
|
Version Info > Version ID |
This is the internal version number which starts at 1 and increases by 1 with each version. |
|
Version Info > Modified By |
The user who modified the displayed version. |
|
Version Info > Modify Date |
The modify date of the displayed version. |
|
Cycle Info > Review Date |
If the version displayed has been reviewed then display the date and time it was reviewed. |
|
Cycle Info > Approval Date |
If the version displayed has been approved then display the date and time it was approved. |
|
Cycle Info > Endorsement Date |
If the version displayed has been endorsed then display the date and time it was endorsed. |
|
Cycle Info > Reviewed |
Displays "No" or "Yes" for the diagram version displayed |
|
Cycle Info > Approved |
" |
|
Cycle Info > Endorsed |
" |
|
Image |
Use an appropriately sized image because inserted images are not scaled. |
Page Setup
To modify the page size and other printing options:
-
From the menu bar, click File, then click Page Setup (this command is only displayed for checked out diagrams)
-
Set Page Size and Orientation as desired
-
Set Pagination to Book Mode or Poster Mode
-
Book mode: When printed to PDF, headers and footers will be applied to every page of the diagram. In the browser, the header and footer are only displayed for the whole diagram.
-
Poster mode: When printed to PDF, headers and footers are applied to the whole diagram.
-
-
Set Print Comments, Print Notes, Print Shape Legend as desired
-
Click OK
Printing
Diagram printing is performed indirectly via PDF files. To print a diagram:
-
From the menu bar, click File, then click Print to PDF
A PDF is stored in your browser Downloads folder
-
Use any tool that can open PDF files to print the saved PDF.
This article contains
See Also