Mining Variant Overlay
Mining Variant Overlay allows data from a Process Mining Project to be overlayed on top of a Web Diagram.
This is an early access feature.
Quick Start
Open a web diagram.
Open the process mining sidebar page.
Select a mining project.
Wait for the conformance model to compute. This can take a while depending on the size of the project and the size of the diagram.
Select a variant to overlay it on top of the diagram.
Tutorial
This tutorial assumes that you have project admin access to at least one Process Mining project with data.
In this tutorial, we will be looking at this project, which contains data about a Purchase To Pay process.
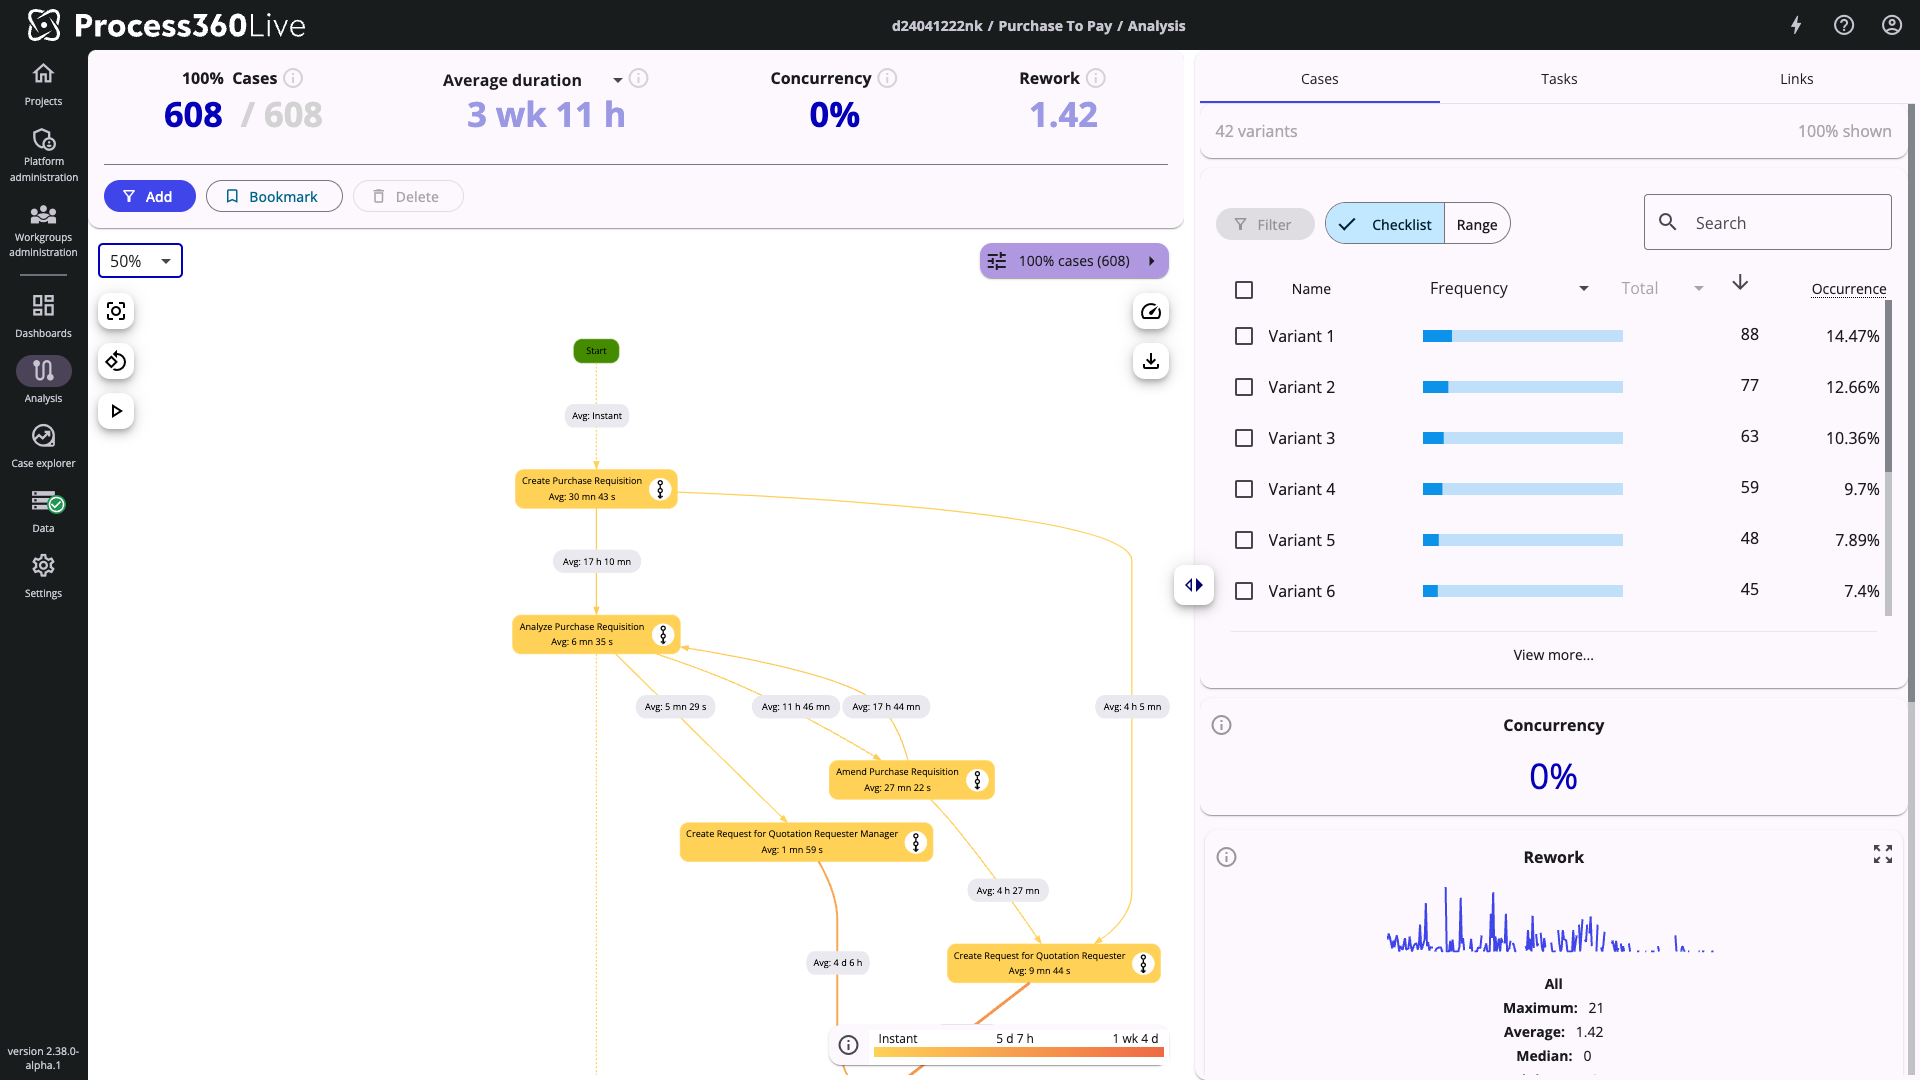
Purchase To Pay project in Process Mining
This is a Web Diagram that documents the Purchase To Pay process represented by the mining project above.
Any diagram can be used with this feature as long as it can be interpreted by Process Mining.
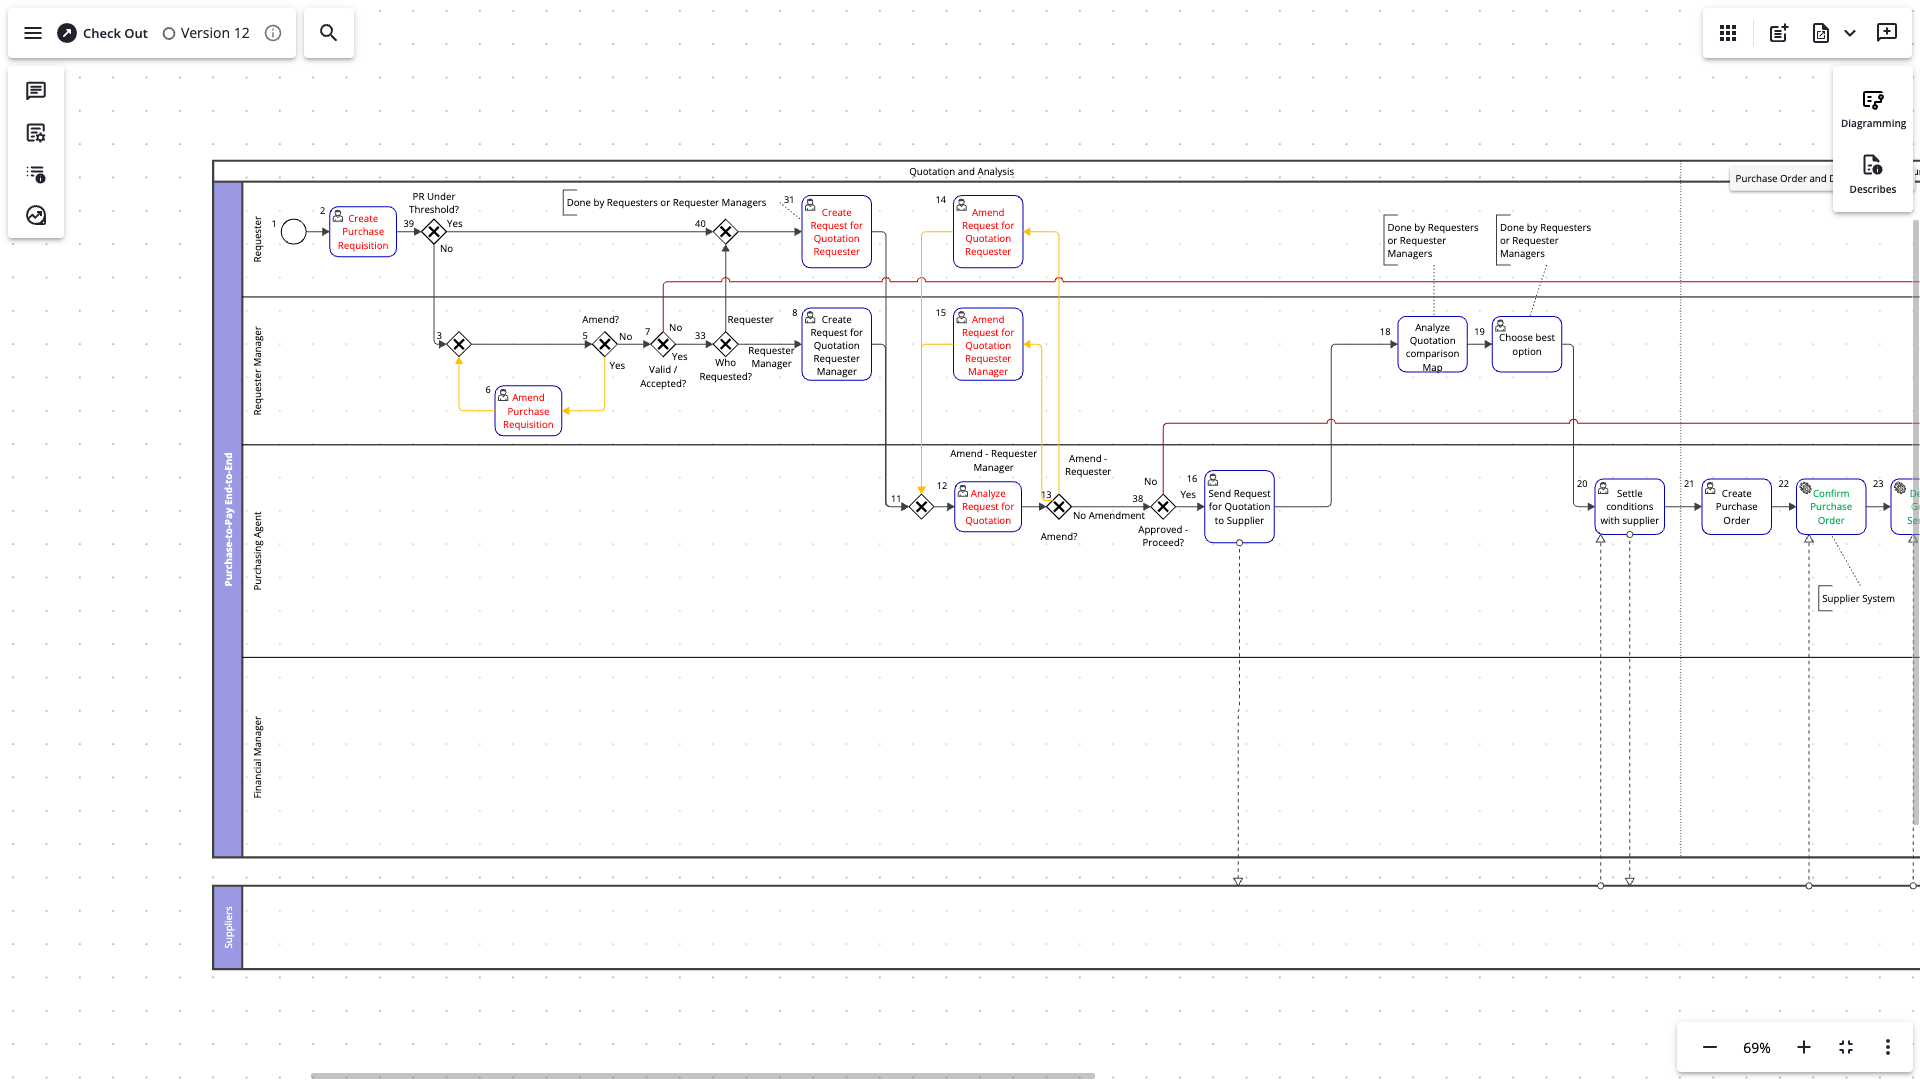
Purchase To Pay diagram in Process Design
To get started, open the Process Mining sidebar page. The page will display a list of projects that you have admin rights to. We’ll select the Purchase to Pay project and then click Link.
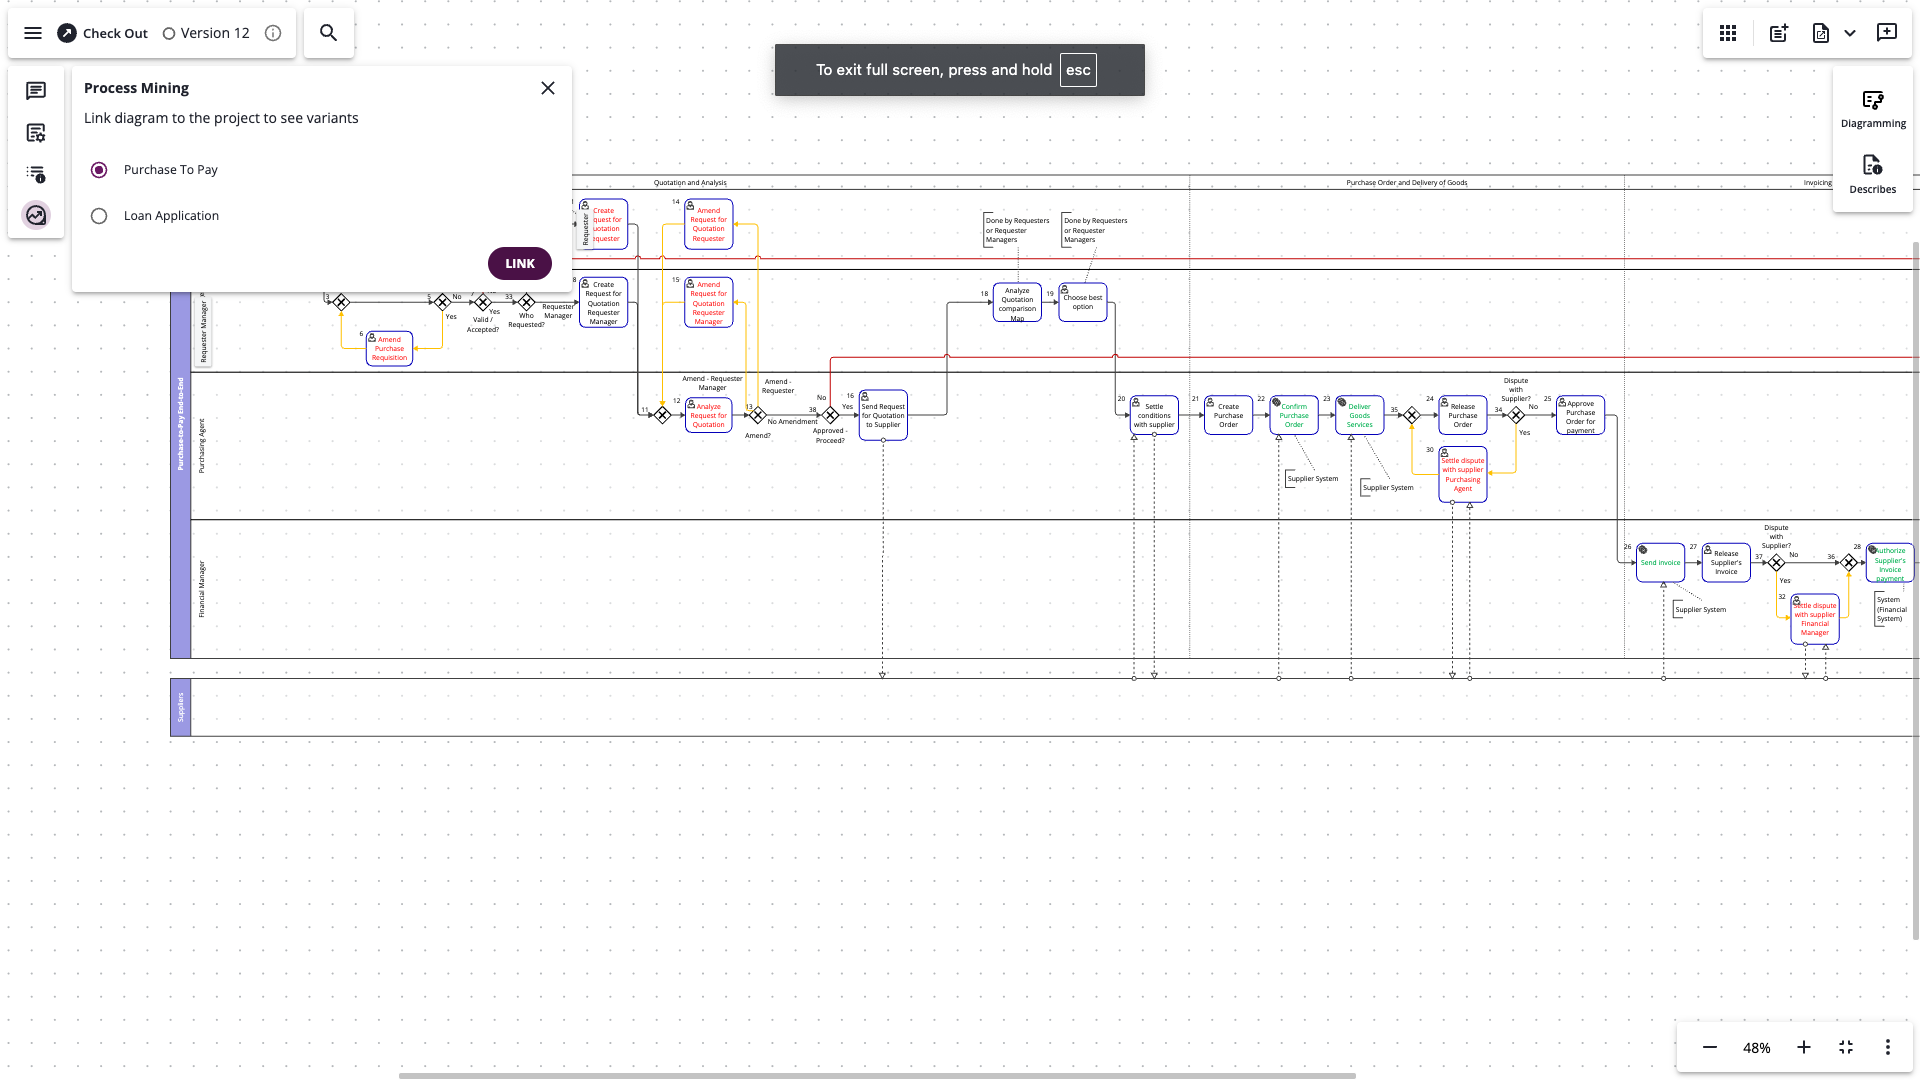
The Process Mining sidebar page
After clicking link, Process Mining begins to compute a conformance model from the diagram. This process can take some time and will continue even if the application is closed.
While waiting, you can browse the project variants and statistics.
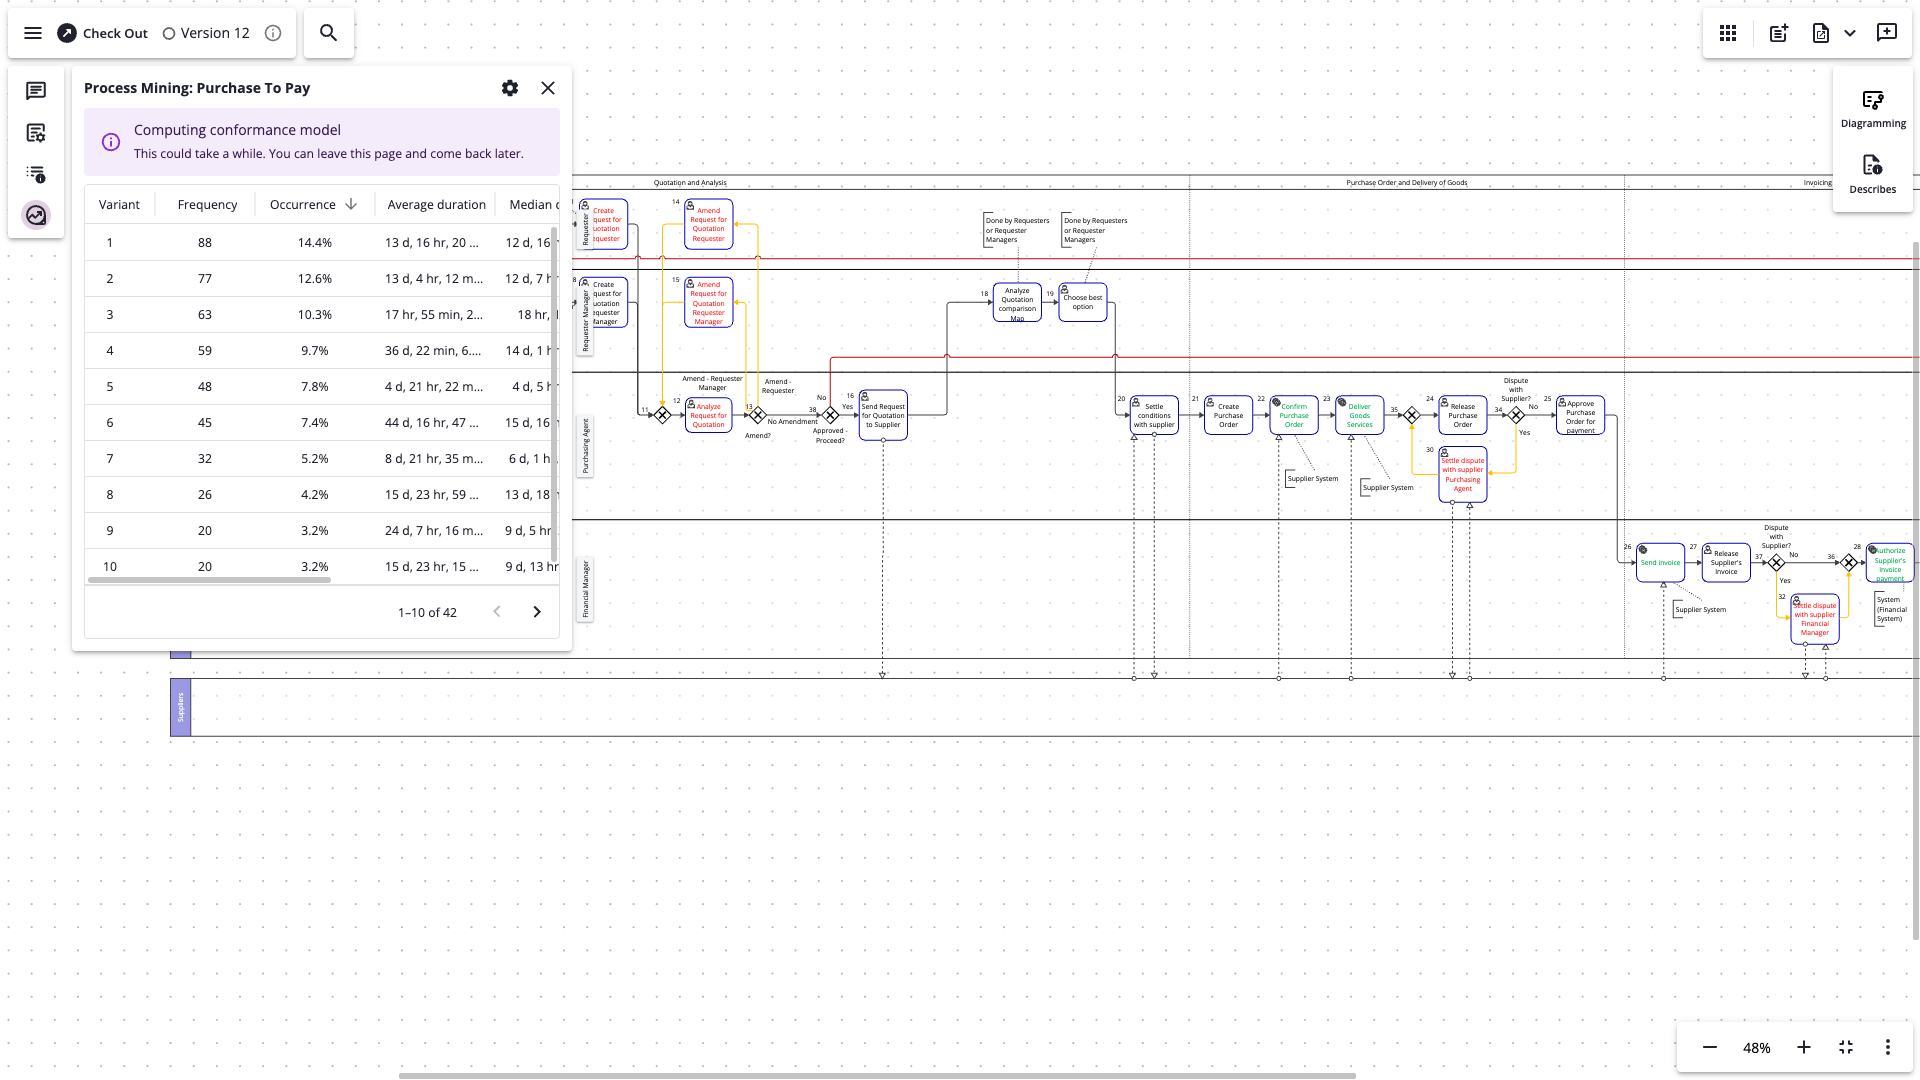
Computing model
Once the model has finished computing, checkboxes will appear in the variants list. Select a variant to enable the overlay.
In this example, there are two tasks which aren’t documented in the diagram but are included in the mining project. These shapes are displayed with dashed border at the bottom of the diagram.
Connections between tasks that aren’t included in the diagram are displayed with a dashed line.
Tasks and connections in the diagram that don’t occur in the variant are faded out.
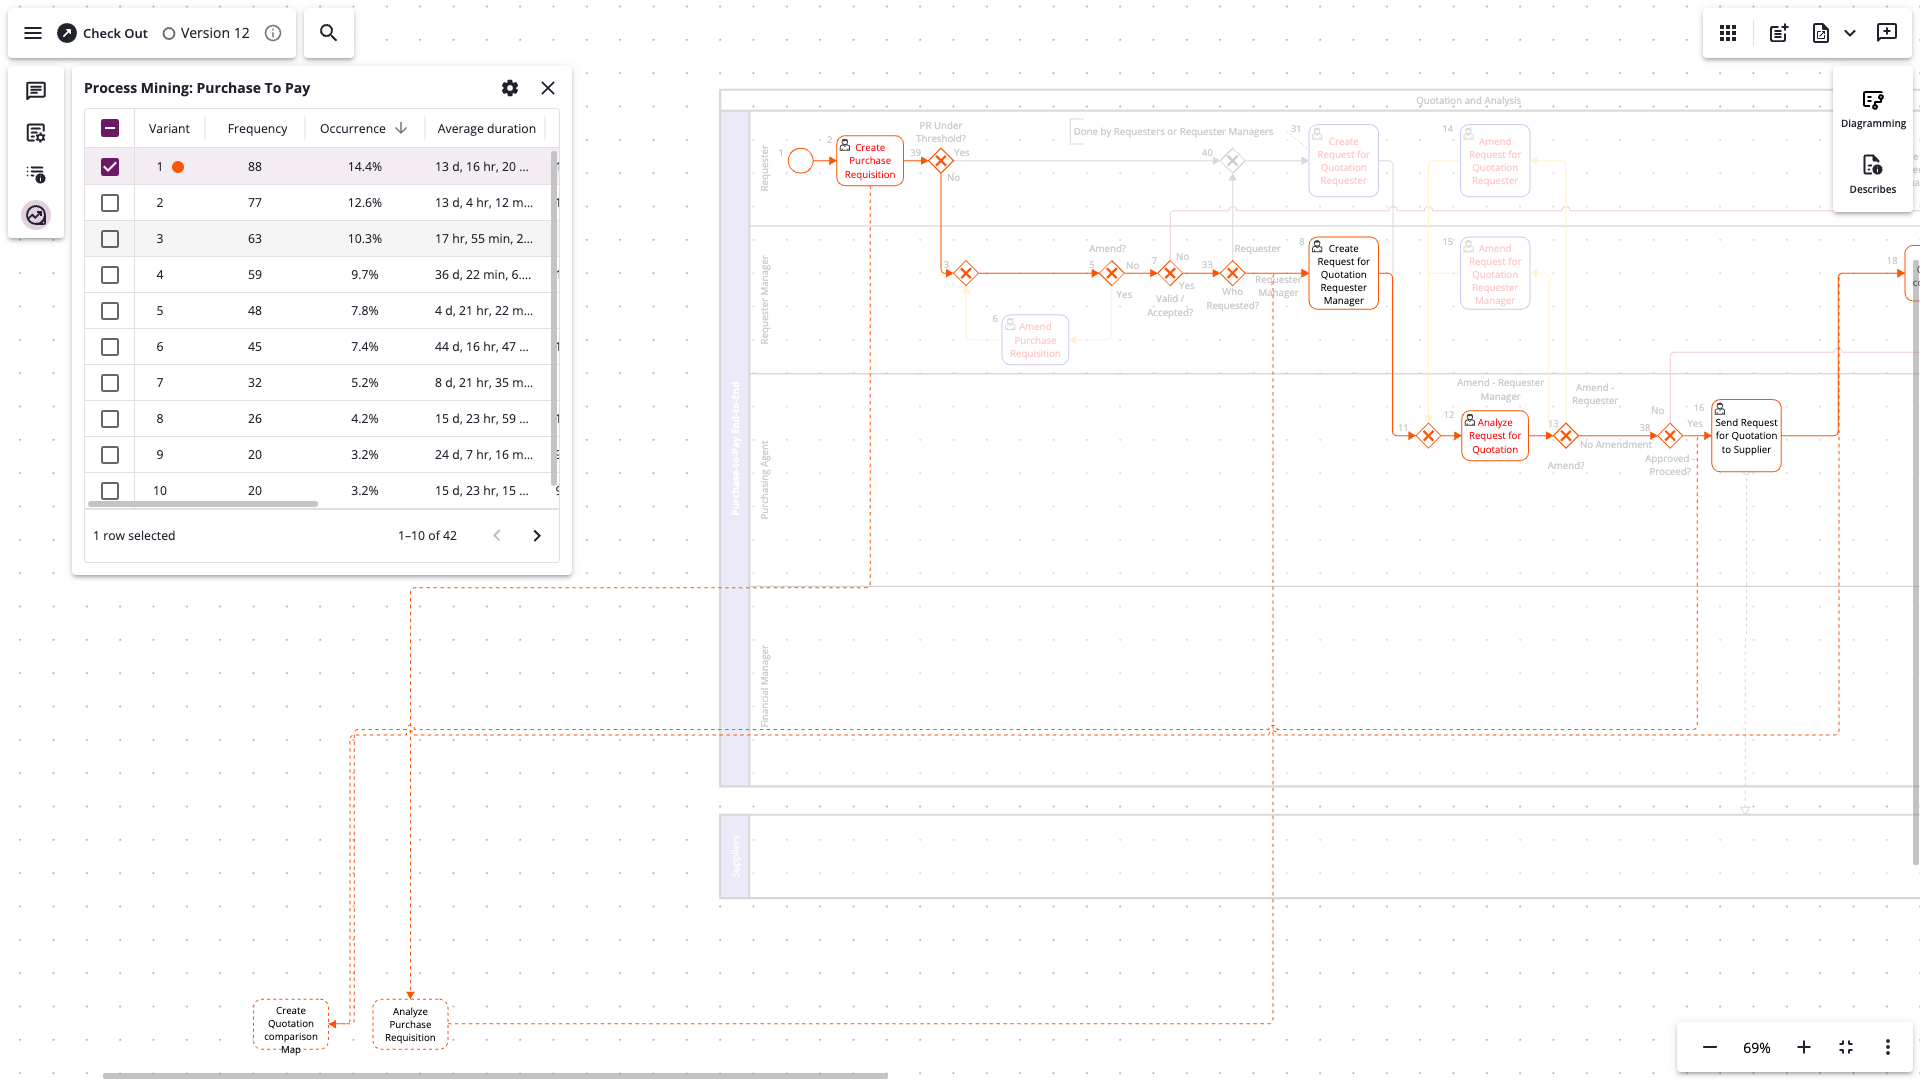
Variant overlay with unmapped tasks
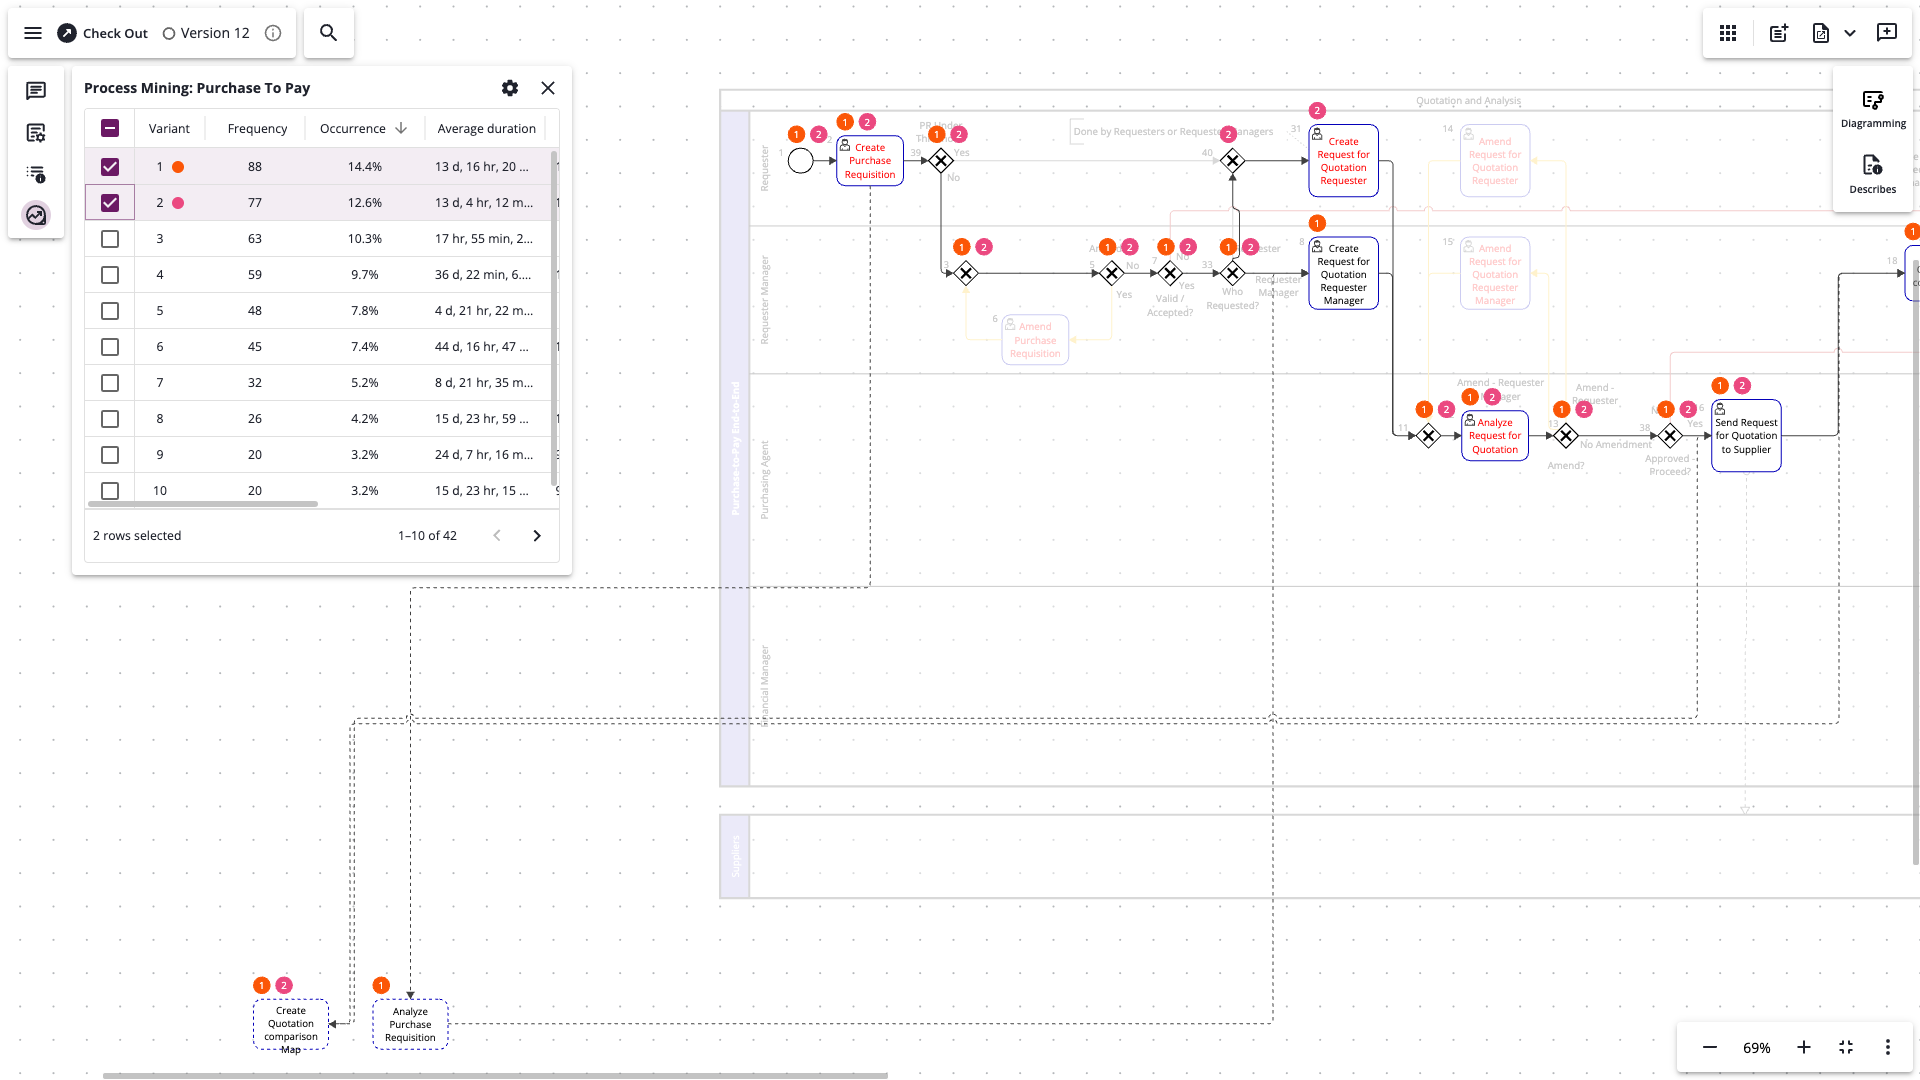
Multiple variants can be selected at the same time. Each variant is assigned a unique name and color which is displayed above tasks in the diagram that occur within that variant.
The link that we created between the diagram and mining project can be viewed from the Process Mining application as well. A model is created in Process Mining and can be viewed from the project settings page. Whenever a new version of the diagram becomes available (after check-in), the corresponding model will be updated.
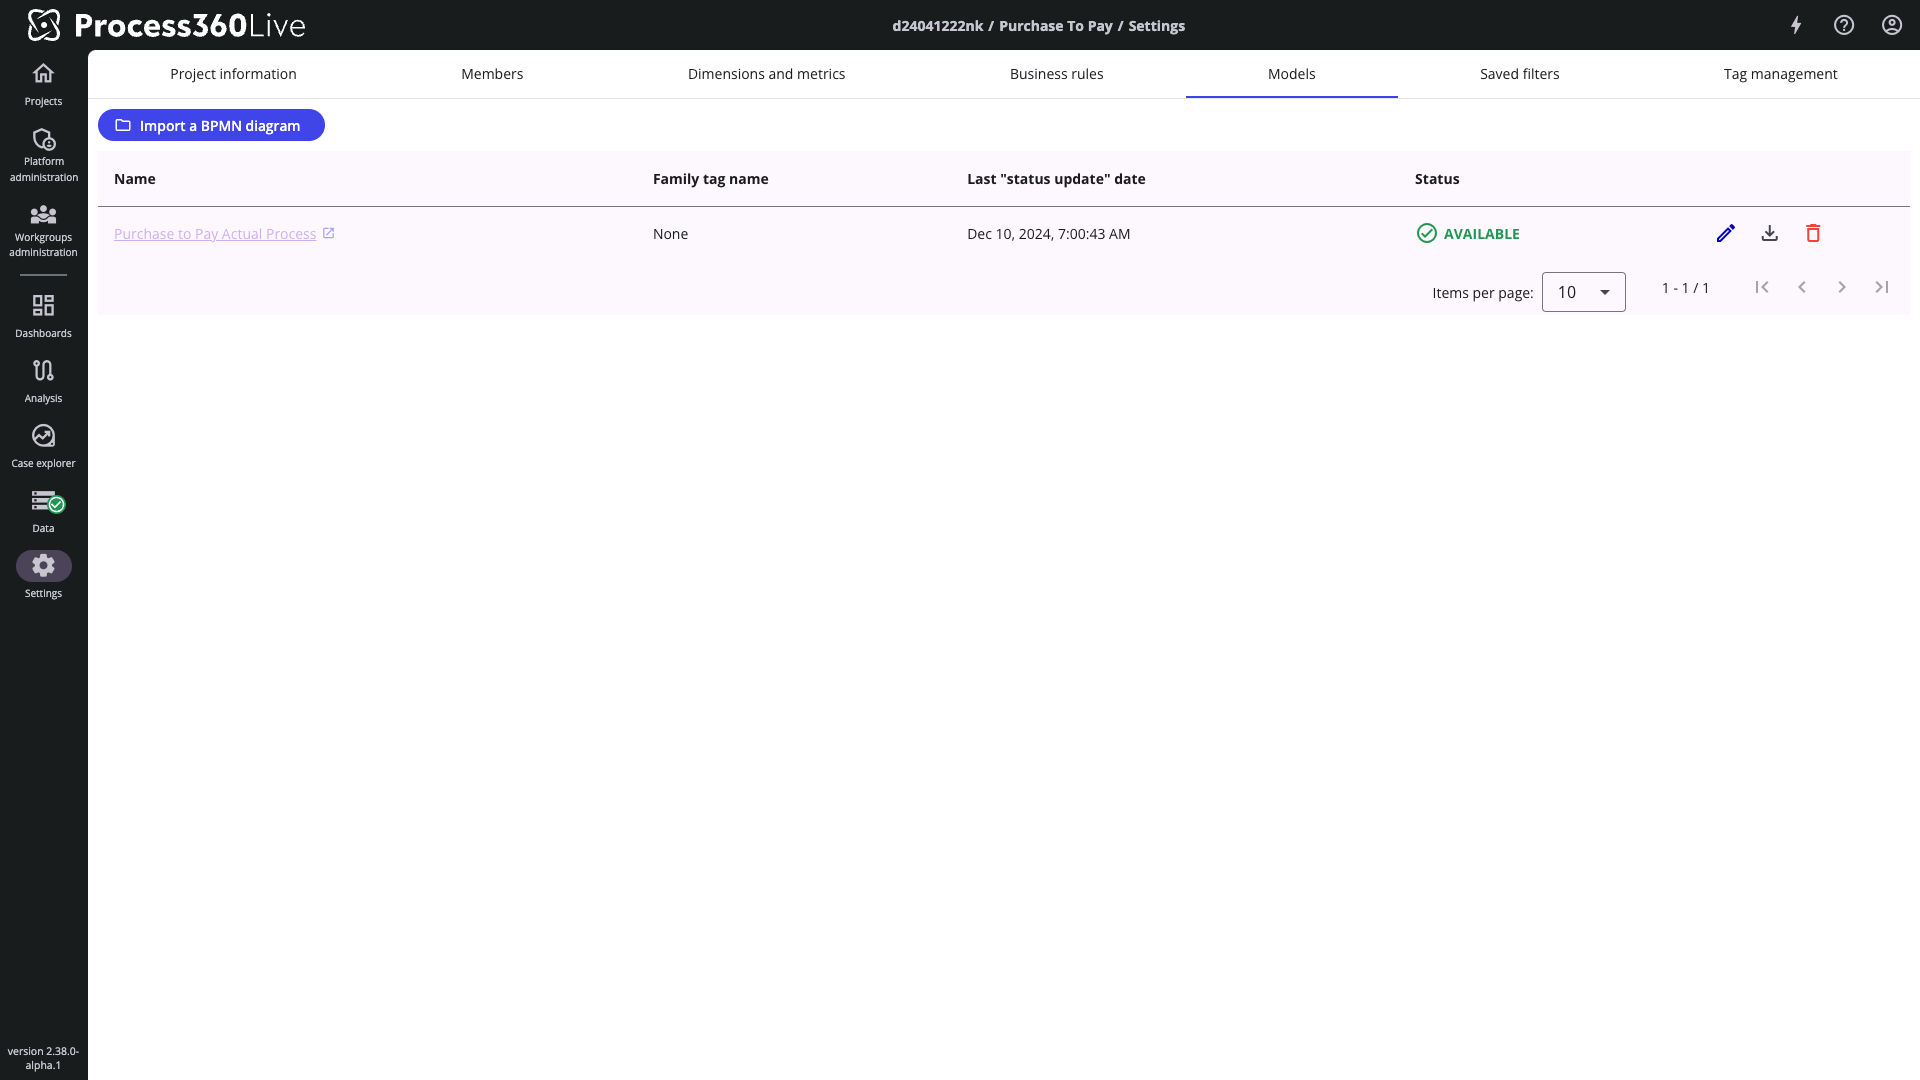
Linked model in project settings page
Adjust the statistics that are displayed by hovering over a column header and selecting the three vertical dots. Click Manage columns to change the columns that are displayed.
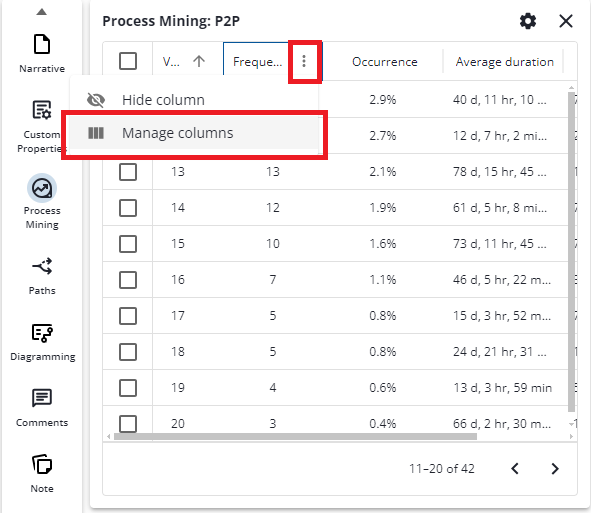
Statistics may also be rearranged into a different order by going to the column header and dragging it to a different location.
Matching Mining and Modeling Activities
Mining Variant Overlay matches activities in Process Modeling to activities in Process Mining by comparing the text of the activity name in the diagram to the activity name as specified in Process Mining logs. If the name of an activity does not match in both mining and modeling then Mining Variant Overlay will represent a new activity in the Process Model based on the name of the activity in Mining.
