This article applies to iGrafx Process and iGrafx Process for Six Sigma Client tools
Overview
iGrafx 2009 and later has functions allowing access to initialize and store the information in simulation arrays or attributes to and from a Sheet component. The functions get and store information into an iGrafx 'Sheet' component, and you can paste data into a Sheet from a spreadsheet application (such as Microsoft Excel) if desired.
To get started, please review the following documentation, and specific functions documented in the Help system:
-
Sheet Components (in Documents and Diagram Procedures)
-
Simulation Functions (in System Defined Functions Reference, and the System Defined Functions Addendum)
-
ArrayInitFromSheet()
-
ArrayStoreToSheet()
-
CellID()
-
CellRow()
-
CellColumn()
-
SheetGetValue() [v14.0 and later]
-
SheetPutValue() [v14.0 and later]
-
These functions can be executed at any time during a simulation run as part of any expression in the model.
Example
Consider an example where we want to simulate printing a certain number of 'jobs', each print job having a number of sheets to print between 1 and 100 sheets of paper. The following picture shows an iGrafx session with an example model, showing the document Components window, the process diagram with fields and text explaining the model, and the Sheet component with its data values:
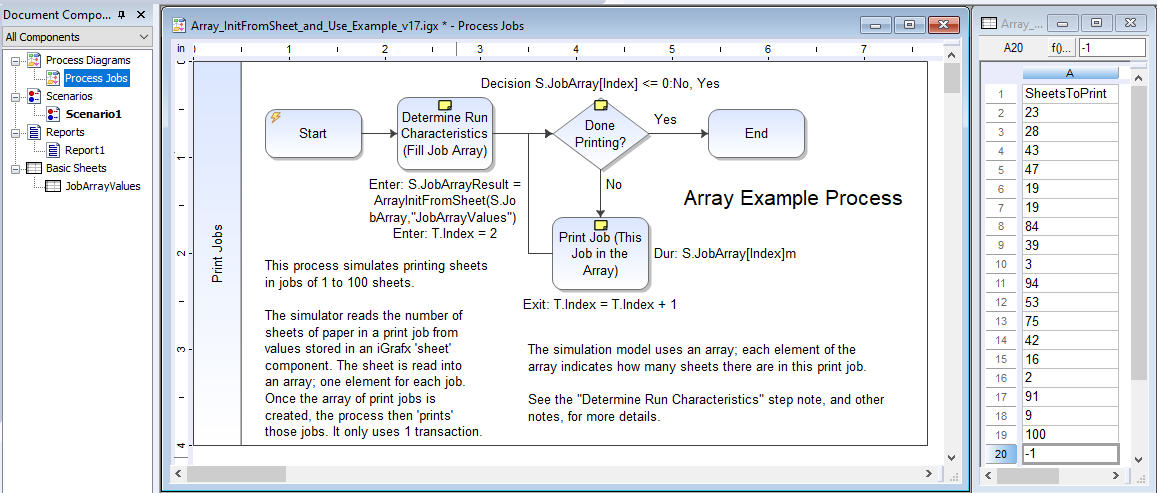
We have an iGrafx 'Sheet' component named "JobArrayValues", with a single column of data. The column is called "SheetsToPrint", and it has 20 rows; one header label, 18 rows of print jobs, and 1 row to indicate the end of the data with a value less than or equal to zero (e.g. -1). We can read these values into an array stored in a Scenario attribute called "JobArray", and then refer to these array values in expressions; e.g. with "S.JobArray[Index]", where 'Index' is a value between 2 and whatever row we will read next. We can store the index in a Transaction attribute, and increment that attribute each time we read a row.
In order to read in the entire column of data (into a 1-dimensional Scenario attribute array), we can use the ArrayInitFromSheet function call, in an expression like the following:
ArrayInitFromSheet(S.JobArray,"JobArrayValues")
This says to read the data from the sheet named "JobArrayValues" into a Scenario-location attribute named "JobArray". It will return the Cell at the end of the data (e.g. "A20"). This could be useful in other models, and we don't use the result in this case, as we've marked the end of data in the data itself. In order to ensure we start using this array appropriately, we set our "T.Index" (or simply "Index"; the "T." prefix is optional for Transaction-location attributes) to 2, as the first row is the column name and does not contain data.
Once we have the array populated, we simply need to use the values in the array to control our model. For example, we can check to see if we have reached the end of the data with an Outputs expression (on a Decision) like the following:
S.JobArray[Index] <= 0
If the element of the array is less than or equal to zero, we know we've found our marker at the end of the data; if it isn't, we need to print the job with the number of sheets indicated by the current row, and fetch the next row. If we have found the end of the data, then we are done printing and the process can end. So, for example, in the data shown, "T.Index" will start at 2, and "S.JobArray[2]" has a value of 23. That's greater than zero, so we'll follow the 'No' path and print the job.
We can use the array values anywhere an expression is allowed, including in Duration expressions. So the following causes the "Print Job" step to take 1 minute per sheet for each job:
S.JobArray[Index]
In our example, if the Index is 2, then "S.JobArray[2]" has a value of 23, and it will take 23 minutes to perform the 'Print Job' step.
We also want to increment the index to the next row before we check that row for whether we have more to print, or if we've reached the end of the data. We do this by incrementing the Index by one; e.g. "T.Index + 1". So when the transaction next goes to the decision, Index will (for example) be 3, and "S.JobArray[3]" has a value of 28, which is greater than zero, so we'll send the transaction back to the Print Job step. We'll keep doing this until we reach the row with a value less than or equal to zero; e.g. row 20, with a value of -1.
Simulation uses a standard Sheet Diagram to store and retrieve this information at run time, making it visible to the naked eye as well as VBA by scripting into the Diagram itself. The Diagram can be viewed, edited, and accessed by hand or with VBA API methods. Our consultants can help you with further details if needed.
If You Are Not Using Sheets (e.g. Pre-iGrafx 2009)
If you are using a version of iGrafx older than iGrafx 2009, alternate methods to set initial values in an array might be:
-
Put the desired data for each transaction into an Excel spreadsheet that a generator reads when it creates each transaction (pre-assign the data on specific transactions, using Excel functionality)
-
Use a separate process map (driven by its own generator, set to introduce transactions at simulation start) to assign values for each component type in your array.
-
Use a VBA function to read from an Excel spreadsheet as you fill the array with values. Our consultants can help you with further details if needed.