If you are unfamiliar with the BPMN notation then first read these appendixes at the end of this Guide:
Draw a BPMN Diagram
-
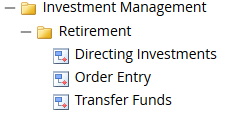
In the repository tree, expand the "Investment Management" folder and then the "Retirement" folder
-
Click the "Retirement" folder to highlight it
-
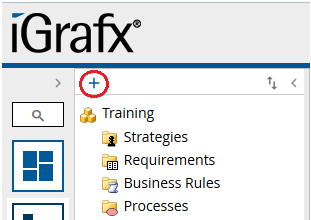
Click the Add button above the "Training" repository name
-
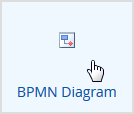
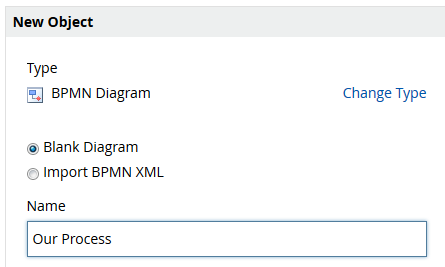
On the right side, click "BPMN Diagram"
-
In the Name field, type "Our Process"
-
Optionally enter a Summary
-
Click

If the "Create Object" command is not visible then scroll to the page bottom. -
In the repository tree, a new diagram has been created, "Our Process" and Checked Out of the repository
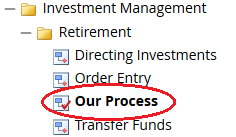
The red check mark indicates "Checked Out". Bold text indicates "Checked Out by Me". -
In the repository tree, click "Our Process"
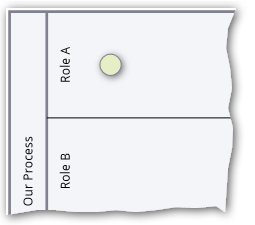
A blank canvass is displayed: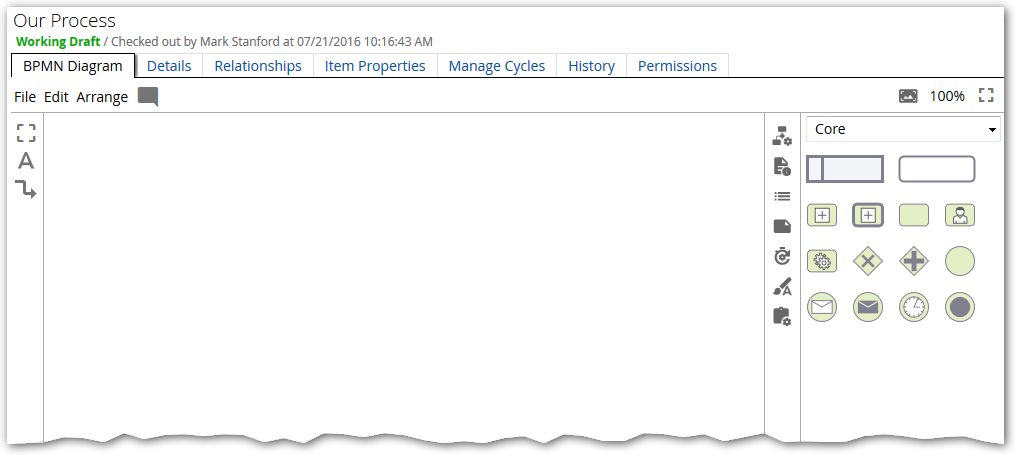
Add Pool and Lanes
-
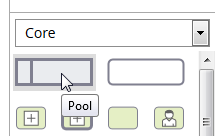
Perform these steps to add a "Pool" to your diagram:
-
In the Shape Palette, click down on the Pool object and keep your left mouse button down
-
Drag the cursor to the diagramming canvas
-
Release the left-mouse button in a location where the whole Pool will be visible
-
-
Click the Pool header (see below) and then type "Our Process"
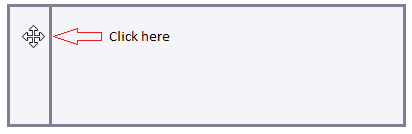
-
Click outside the edit box to finish the label

Label Pools with participant (e.g. business unit), process names or resource names.
-
Add two lanes to the Pool by clicking the Pool header and then click the

icon (on the Pool border) twice
Naming Lanes
-
Click the word "Lane" in the top swimlane of the Pool
-
Type "Role A"
Depending on the contents of your repository, when editing a swimlane or shape label, an icon with down arrow may appear. This tells you there are repository objects which you can link the Lane to.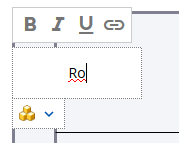
-
For now, ignore the repository arrow, and type "Role A"
-
Click outside the edit box
-
Re-label the middle lane to "Role B"
-
Re-label the bottom lane to "Role C"
To link a lane label to a repository object, see the Label Lanes and Shapes with Describes Relationships section.
The diagram should look similar to this: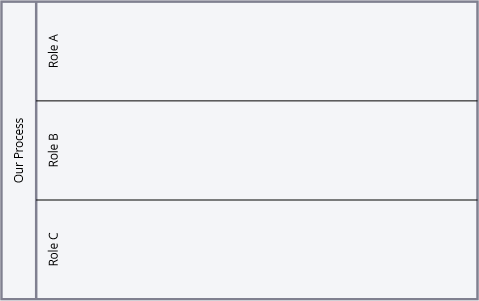
Add Event and Task Shapes
Perform these steps to add an Event and Task shape to the diagram:
-
In the Shape Palette, click down on the "Generic Event" shape and keep your left mouse button down
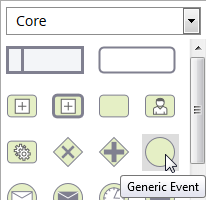
-
Drag the cursor to the "Role A" lane, just right of the text
-
Release the left-mouse button
-
The diagram should look similar to this:
Begin and end BPMN process flows with an Event (circle) shape.
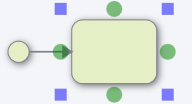
Add a second shape:
-
Click the Event shape
-
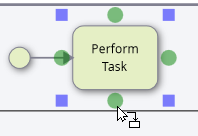
Click the green icon on the right face
-
A new "Generic Task" shape and connection line are added:
Label the new shape:
-
With the new shape still highlighted, type "Perform Task"
-
Click outside the edit box
-
The diagram should look similar to this:
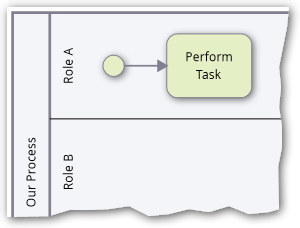
Label "Task" shapes with a "Verb Noun" text phrase
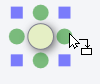
Add a second Task shape using the "drag and add" method:
-
Click the "Perform Task" shape
-
Click down on the lower green dot and keep your left mouse button down
-
Drag the cursor down past the "Role B" lane to the "Role C" lane
-
Release the left-mouse button
-
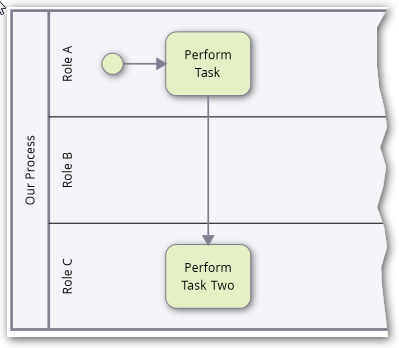
With the new shape highlighted, type "Perform Task Two"
-
The diagram should look similar to this:
Move Shape
-
Move a shape via drag and drop:
-
Click down on the "Perform Task" shape and keep your left mouse button down
-
Drag the cursor in any direction
-
Release the left-mouse button
-
-
Move a shape via arrow key
-
Click a shape to highlight it
-
Press any arrow key
-
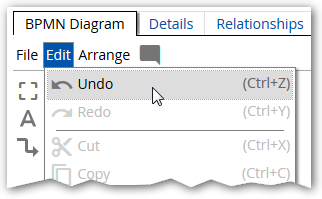
Undo
-
Type CTRL-Z to undo moves or other actions (or use Edit -> Undo available at the top, left of the canvas)
Add Gateway Shape
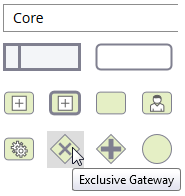
Gateways are used to control how process flows split and merge. If the flow does not need to be controlled, then a Gateway is not needed. The Exclusive Gateway (decision) and Parallel Gateway (join) are the two most commonly used Gateways and are available in the "Core" BPMN palette. See Appendix for more information about Gateways.
Perform these steps to add an Exclusive Gateway (decision) shape to the diagram:
-
In the Shape Palette, click down on the "Exclusive Gateway" shape and keep your left mouse button down
-
Drag the cursor to the diagram near "Perform Task Two" (as shown below)
-
Release the left-mouse button
-
With the Gateway highlighted, type "Do Role B Task?"
-
Click outside the edit box
The diagram should look similar to this: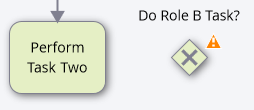
Connect the Task to the Gateway
-
Click "Perform Task Two"
-
Click the green dot on the right face
-
Click outside the highlighted line
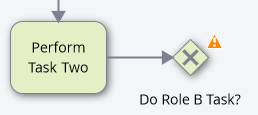
The diagram should look similar to this: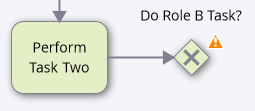
Warning Messages
To maintain conformance with the BPMN standard, warning icons may appear while creating a diagram.
-
Click the warning icon

This message is displayed: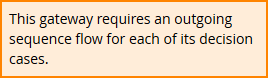
The following steps will edit the diagram to remove the warning
Move Gateway Label
Before adding the Gateway outgoing sequence flow, you'll move the Gateway label from above to beneath the Gateway. You are doing this because one of the sequence flows will exit the top of the Gateway.
-
Click down on the "Do Role B Task?" label (NOT THE SHAPE) and keep your left mouse button down
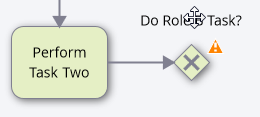
-
Drag the cursor to beneath the Gateway
-
Release the left-mouse button
-
The diagram should look similar to this:
Add Gateway Sequence Flow
-
Click the Gateway shape
-
Click the green dot at the top face of the Gateway
-
Click the Gateway shape
-
Click the green dot at the right face of the Gateway
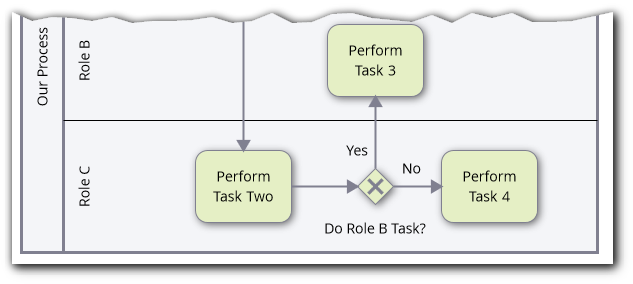
The warning icon disappeared because you have two sequence flows from the Gateway. -
If necessary, move the shape in the "Role B" lane so that it lies entirely within the lane
-
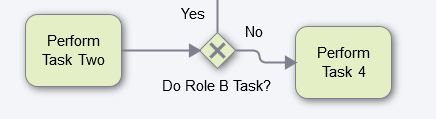
Label the new shapes "Perform Task 3" and "Perform Task 4" as shown below:
Change or Add Case Text

To change the case text:
-
Click the Gateway shape to highlight it
-
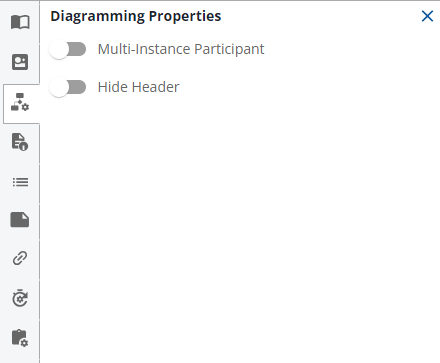
On the right frame, click the Diagramming Properties button

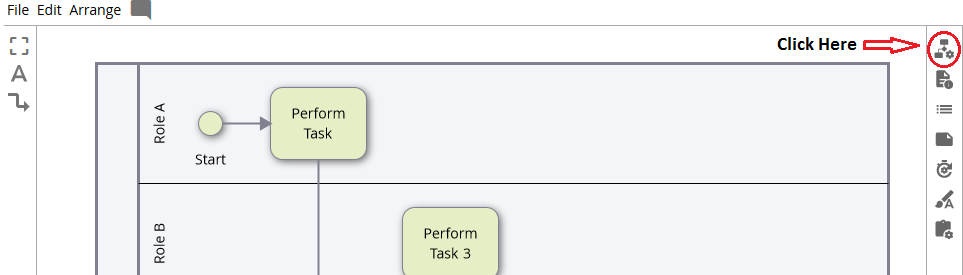
-
Under "Cases" edit the "Yes" and "No" text as desired:
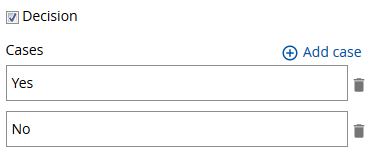
-
To create additional cases (e.g. you are creating a Gateway with three paths), click the "Add case" button
-
Click the Diagramming Properties button

to close the dialog
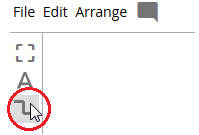
Use the Line Tool
-
Click the Line Tool on the left frame:
-
Place your cursor in the middle of the right face of "Perform Task 3":
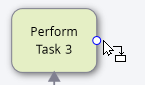
-
Left-click down and keep the left mouse button down
-
Drag the cursor to the top of "Perform Task 4" as shown:
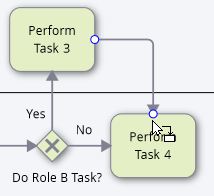
-
Release the left-mouse button
-
Click the Line Tool

again to return to regular editing mode
The diagram should look similar to this: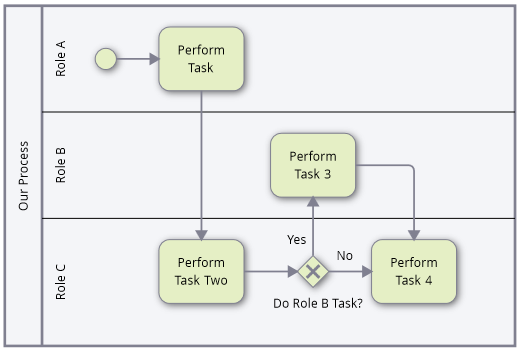
Select Multiple Objects
When editing a diagram, you may need to select multiple diagram objects for moving, deleting, or aligning diagram objects.
Before using the Select Tool, you will move a shape out of alignment and later use the Arrange command align three shapes.
-
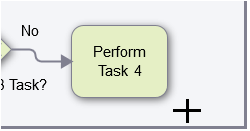
Click the "Perform Task 4" shape
-
Press the down arrow key twice so the diagram looks similar to this:
-
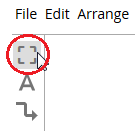
Click the Select Tool in the left frame:
-
Place the cursor below and right of the "Perform Task 4" shape:
-
Left-click down and keep the left mouse button down
-
Drag the cursor above and left of "Perform Task Two" to highlight shapes as shown:
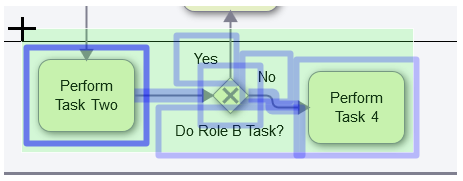
-
Release the left-mouse button
Leave the shapes selected and proceed to the next section.
Arrange Shapes
-
In the top frame, click "Arrange"
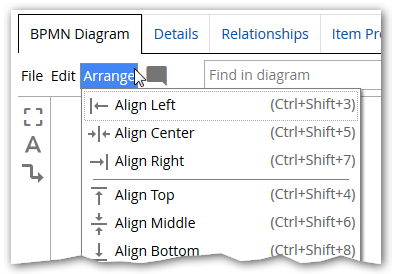
-
Click "Align Middle"
-
To unselect, click outside the selected region
The "Perform Task 4" shape should now be realigned with the other two shapes in the swimlane: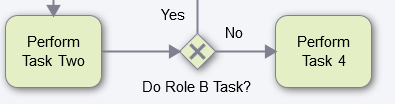
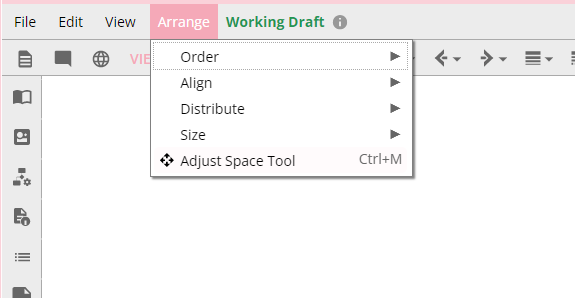
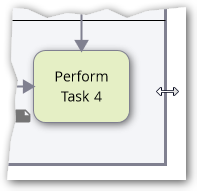
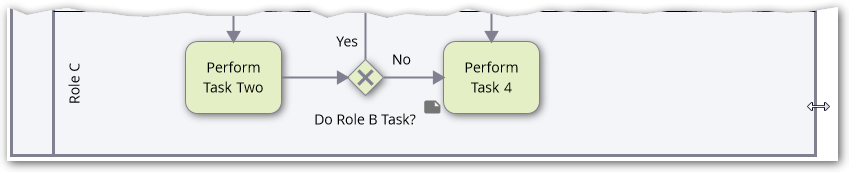
Adjust Space Tool
-
In the top frame, click "Arrange"
-
Click "Adjust Space Tool"
-
Place the cursor where you want to add or remove space from.
-
Drag to the right or down to add space.
-
Drag to the left or up to remove space.
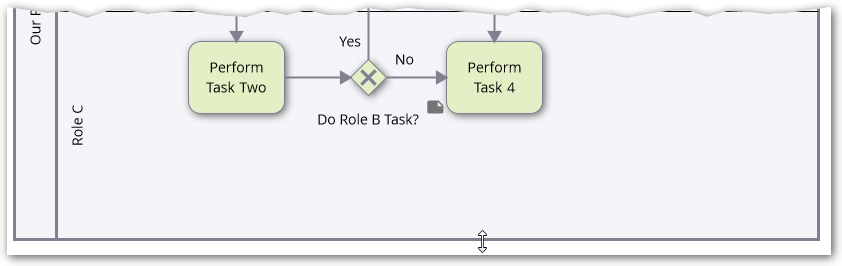
Before:
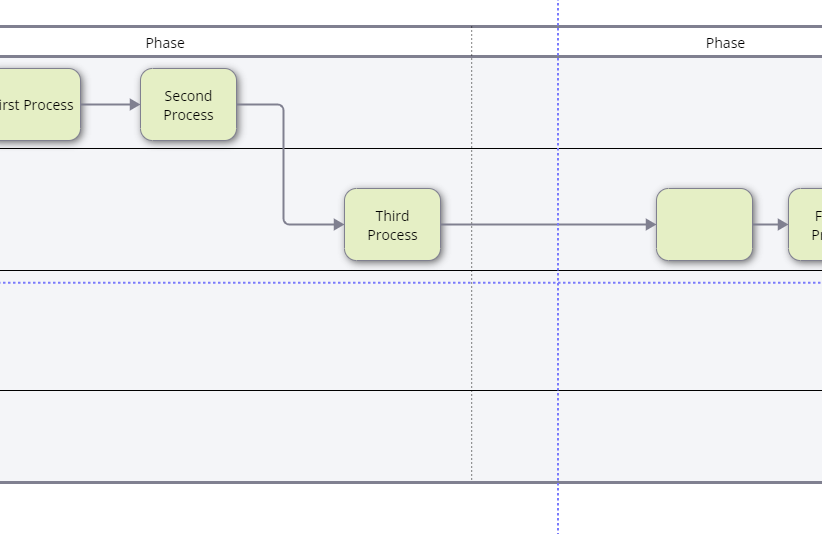
After:
Note: If a pool shrinks to no longer fit all of its children, objects outside the pool will be orphaned.
Artifacts
Artifacts provide additional information about the process to help explain and document the flow. They do not influence the sequence flow. There are three commonly used artifact types:
-
Text
-
Note
-
Annotation
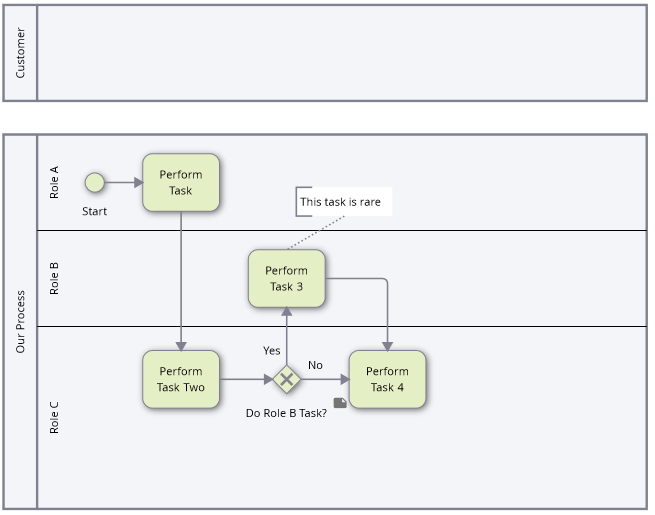
Add Text
-
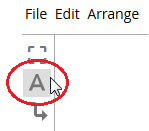
Click the Text tool in the left frame
-
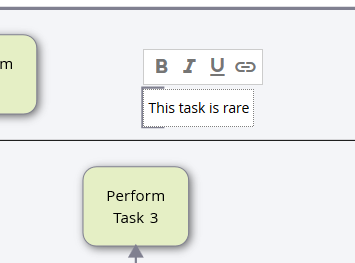
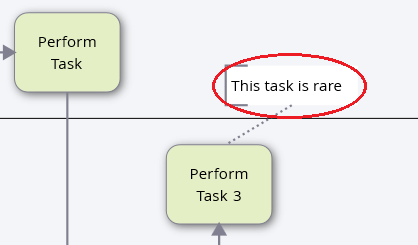
Click the diagram above the "Perform Task 3" shape
-
Type "This task is rare" then click outside the edit box
-
Click the Text Tool

again to return to regular editing mode
Connect Text to Shape
-
Click the Line Tool

in the left frame
-
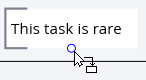
Place your cursor at the bottom middle of the "This task is rare" text
-
Left-click down and keep the left mouse button down
-
Drag the cursor to the top of "Perform Task 3" as shown
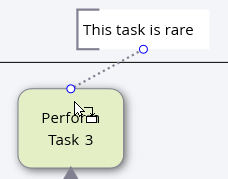
-
Release the left-mouse button
-
Click the Line Tool
again to return to regular editing mode
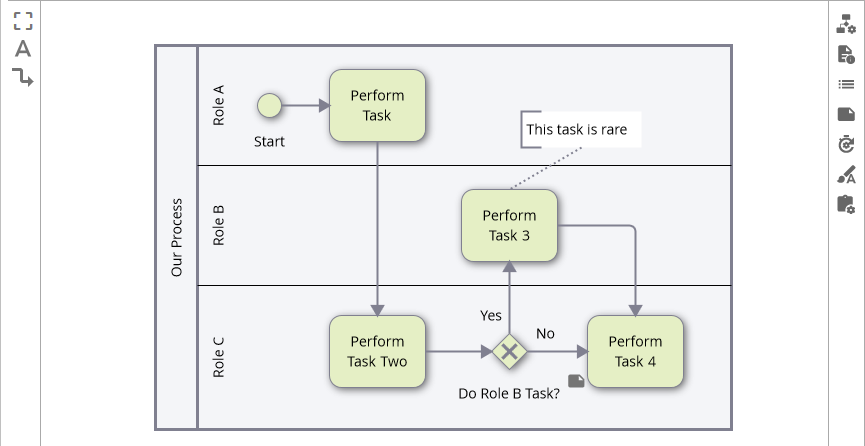
-
Click anywhere to unselect the line:
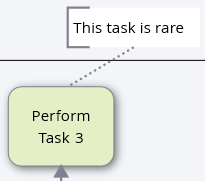
The diagram now contains two line styles:
-
-
Solid lines denoting sequence flow
-
Dotted lines denoting a text artifact associated to a shape
-
The different line styles are specified by the BPMN standard to enhance understanding of the process flow diagram.
Add a Note
Notes are an effective tool for adding supplemental documentation (e.g. detailed instructions, methods and procedures, etc.) to a shape.
-
Click the "Perform Task 4" shape to highlight it
-
Click the Note Tool

in the right frame
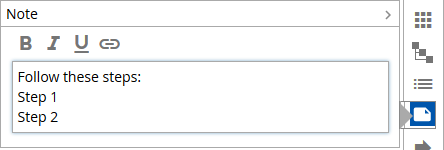
-
Type text in the note text field as shown below:
-
Click the Note Tool

to close the dialog
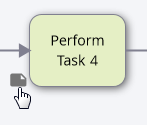
-
A Note icon is now displayed next to the shape
Display a Note
-
Click the Note icon near "Perform Task 4
-
Click the Note Tool

to close the dialog
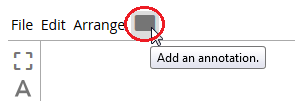
Add an Annotation
Annotations are useful during Review Cycles when users want to make comments at a specific location on a diagram. It's possible to give users Annotation capability without Authoring permissions.
-
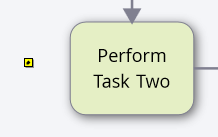
In the top diagram frame, click the Annotation Tool
-
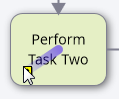
Move the cursor over the "Perform Task Two" shape
-
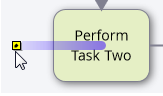
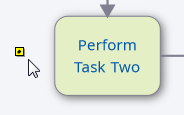
Move the cursor outside the left face of the shape as shown:
-
Click the diagram
-
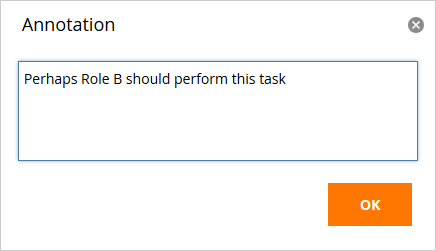
In the Annotation dialog, type "Perhaps Role B should perform this task?
-
Click OK
-
The annotation has been added
The new annotation is associated with the "Perform Task Two" shape because the cursor was hovered over the shape before adding the annotation. When the shape is moved, the annotation will move with it.
View and Delete Annotation Text
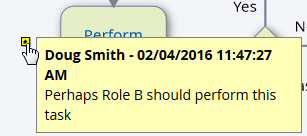
-
Hover the cursor over Annotation icon
-
The Annotation is displayed:
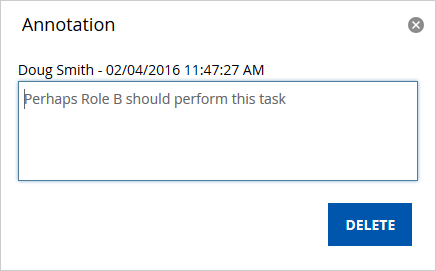
-
Click the Annotation icon
-
Click

Add a Repository Link
In addition to artifacts, supplemental information about the process might be located in your repository, the company intranet, or the Web. In this section, you'll link a shape to an existing Office Word document stored in the repository.
For instructions on how to add documents to the repository, see Managing non-iGrafx Files topic.
To link text to a repository file:
-
Click "Perform Task Two" to highlight the shape
-
Click the shape again to highlight the shape text
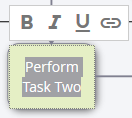
-
Click the Link icon

-
At the top of the dialog, click

-
Click

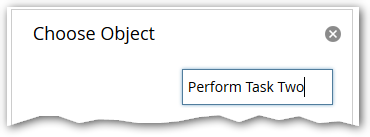
-
In the Search field, type "Perform Task Two"
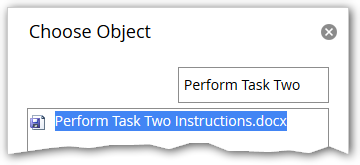
-
The dialog will display an existing repository Office Word document named "Perform Task Two Instructions.docx"
Office Word documents only appear in the dialog if you are using a repository (such as the iGrafx "Training" repository) containing Word documents.
-
Click the document name
-
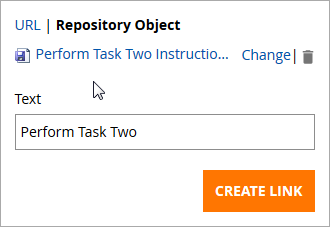
Click Choose
By editing the text in the "Text" box, you can change the text associated with the link. For now, don't edit the text. -
In the Link dialog, click

-
Click outside of the highlighted shape text
The shape label text is drawn blue to indicate the link: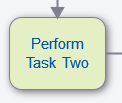
-
Repository links can be created on any diagram text.
Open a Linked Document
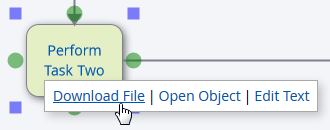
-
Click the "Perform Task Two" label text
-
Click "Download File"
-
The next dialog will vary depending on the browser used, click Open to display the file
-
Close the Word document
Add a Web Link
-
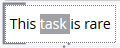
Click the text "This task is rare"
-
Click the text again to highlight the text
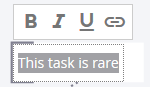
-
Double-click the word "task" so that only that word is highlighted
-
Click the Link icon above the text
-
In the URL field, type "www.dictionary.com/browse/task"
-
Click
-
Click outside the text field
You have linked the diagram word "Task" to a Web dictionary definition. Web URLs can be associated with any diagram text. Users can open the linked web page using the same method used to open linked repository files.
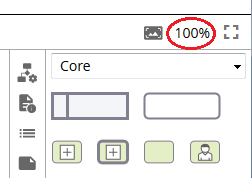
Zooming
-
In the top, right diagram frame (above the shape palette), click the Zoom tool "100%"
-
Type "200"
-
Click the Zoom tool again and type "100" zoom out
-
If your mouse has a scroll wheel, use the wheel to zoom in and out
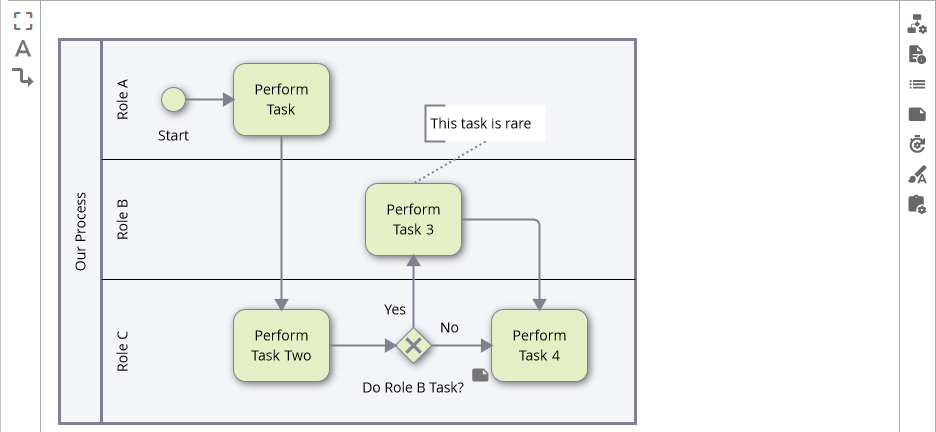
Moving the Pool
-
Zoom out so that there is empty space on the side of the Pool:
-
Click down on the Pool header "Our Process" and keep your left mouse button down
-
Drag the cursor left until the Pool header is near the left Toolbar
-
Release the left-mouse button
Growing the Pool
Later instructions in this Guide will add shapes to the right and below the "Perform Task 4" shape. These steps will grow the Pool to make space available for additional shapes.
-
Click down on the right edge of the Pool and keep your left mouse button down
-
Drag the cursor right until there is room for two additional shapes within the swimlane to the right of "Perform Task 4"
-
Release the left-mouse button
-
In the same manner, also grow the Pool downward so that there is room for shapes under "Perform Task 4"
Add a Second Pool
In later instructions, you are going to connect your current process to a second Pool representing Customers. While you are working with Pools, this is a good time to add the second Pool.
You are now familiar with adding, naming, moving, and growing Pools. Use that knowledge for the steps below.
-
Zoom out so that there is space for another Pool above the existing Pool
-
Add the Pool, position it, name it "Customer", and grow it so that your diagram looks like this:
Hide Pool Headers
Perform these steps to hide an individual pool's header:
-
Select the pool you want to modify from the diagram
-
In the sidebar, click the
icon to open the Diagramming Properties panel
-
Click the Hide Header text or switch
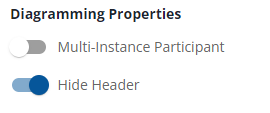
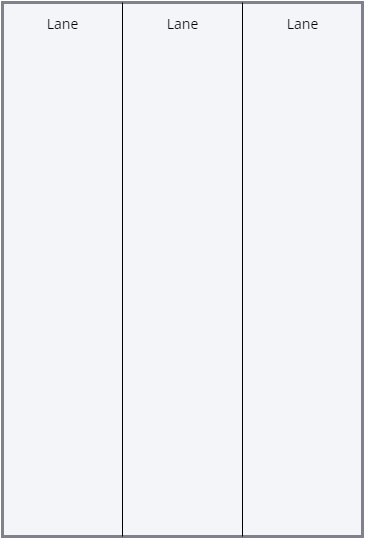
-
The selected pool should look similar to:
-
In BPMN diagrams:
-
Hiding a pool header in the top level of a diagram will display a warning
-
Pool headers are always hidden in sub-processes and visibility cannot be toggled
-
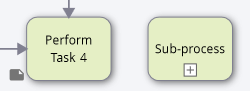
Add a Collapsed Sub-Process
When a process flow contains multiple levels of detail, collapsing shapes documenting an additional level of detail into another diagram can improve readability and understanding.
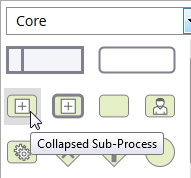
-
Drag and drop a Collapsed Sub-Process shape from the palette to the diagram next to "Perform Task 4"
-
Type "Sub-Process" for the shape label
-
Connect "Perform Task 4" with "Sub-Process"
-
Click the Link

icon on the Sub-Process shape
A sub-process is created in the diagram. -
Add shapes as shown to the sub-process
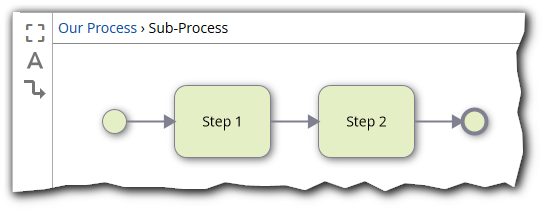
The name of the parent process is displayed above the diagram -
At the top of the frame, click

to return to the parent
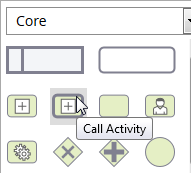
Add a Call Activity
A process flow may link to existing repository diagrams. For example, a top-level process flow might show the flow between multiple existing process flows. When using BPMN, the Call Activity shape links a parent diagram to child diagram. In this section, you'll link a shape in "Our Process" to an existing repository diagram.
-
With "Our Process" displayed, drag and drop a "Call Activity" shape from the palette to the diagram directly under the "Sub-Process" shape
-
Label the new shape "Procurement"
The diagram should look similar to this: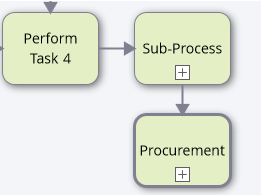
-
Click the "Procurement" shape to highlight it
-
On the right frame, click the Diagramming Properties button
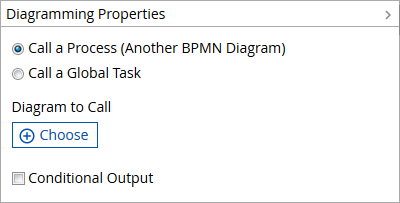
-
Leave "Call a Process (Another BPMN Diagram)" checked
-
Under "Diagram to Call" click "Choose"
-
In the Search field, type "pro"
This step assumes you are using a repository (such as the iGrafx "Training" repository) containing a diagram named "Procurement".
-
The "Procurement" diagram is displayed
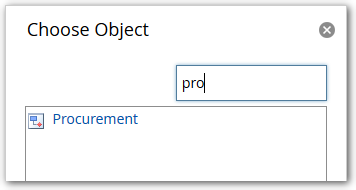
-
Click "Procurement" and then click

-
Click the Diagramming Properties button

to close the dialog
-
Click the Link
icon on the "Procurement" shape
The "Procurement" diagram is displayed and its location highlighted in the repository tree. -
Click the Browser Back button to return to the "Our Process" diagram
You've now created two types of diagram to diagram links:
-
A link to a Collapsed Sub-Process that is contained by and only accessible from its parent diagram
-
A Call Activity link to another repository diagram. The Call Activity shape can link to any diagram visible in the repository tree. The Call Activity shape cannot link to Collapsed Sub-Process diagrams
Add an End Event
Finish the diagram by adding an "End Event" shape.
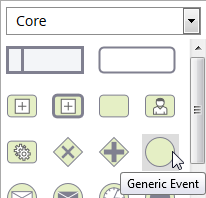
-
Drag and drop a "Generic Event" shape from the palette to the diagram next to "Procurement" shape
-
Connect "Procurement" to the Event and type "End" for the shape label
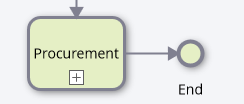
iGrafx detects the incoming sequence flow to the Event shape and automatically draws a thick border to indicate that it's an "End Event". The label provides additional clarity but is not required. You can also label the first Event shape "Start".
Add Messages
Your diagram now shows the order that activities are performed in the process. This is the Sequence Flow displayed by solid line connections between shapes.
Next, you will add Message Flow to represent communication with another process participant –- the Customer in this example. Message Flow is drawn with dashed lines. iGrafx automatically draws the correct line style for you.
Sequence Flow cannot cross Pool boundaries and Message Flow cannot connect objects within the same Pool.
Additional Pools can represent Customers, Suppliers, or Business Units separate from the process.
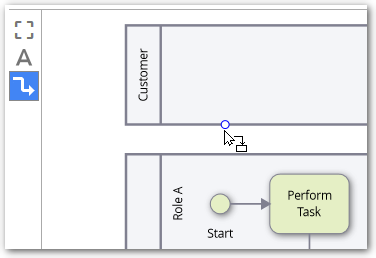
-
Click the Line tool then place the cursor on the "Customer" Pool border directly above the Start shape
-
Left-click down and keep the left mouse button down
-
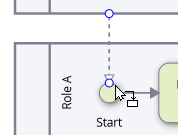
Drag the cursor to the top of "Start" shape as shown:
-
Release the left-mouse button
-
Click the Line Tool
again to return to regular editing mode
-
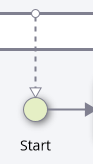
The diagram should look similar to this:
-
If the line isn't straight, click the line to select it, then drag and drop the "Customer" Pool end point.
-
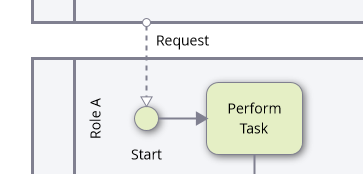
Select the line if it is not selected and type "Request"
-
Click outside the text box and the diagram should look similar to this:
-
The Line Text "Request" communicates what is being sent from the "Customer" to this process.
The Line Text is associated with the line and will move if the line is move
-
Click the "Start" shape to highlight it
-
On the right frame, click the Diagramming Properties button
-
Change the BPMN Event Type drop-down to "Message Receive"
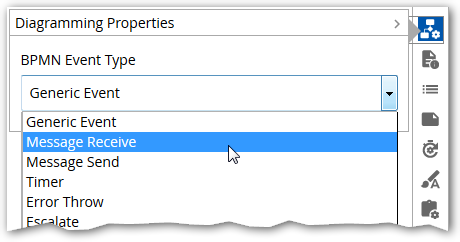
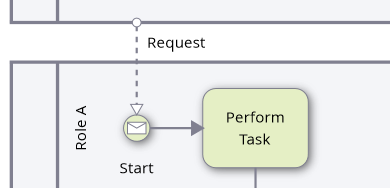
-
The "Start" shape is changed to indicate a "Message Receive" Event:
-
Click the Diagramming Properties button
to hide the dialog box
Next, you'll draw a Message line to communicate to the customer that the request is fulfilled.
-
Using the Line tool, draw a line (preferably straight) from the "End" shape to the bottom border of the "Customer" Pool
-
Click the Line Tool
to return to regular editing mode
-
Click away from the line to unselect the line
-
Click the line to highlight it (yes, unselect followed by select is a bit odd)
-
Type "Request Fulfilled" then click outside the line
-
Move the new text if desired
-
Click the "End" shape to highlight it
-
On the right frame, click the Diagramming Properties button
-
Change the BPMN Event Type drop-down to "Message Send"
-
Click the Diagramming Properties button
to hide the dialog
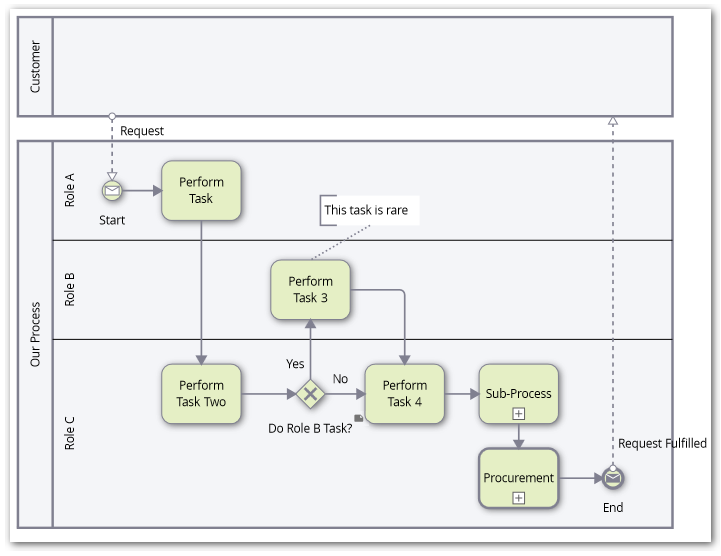
-
Your diagram should look similar to this:
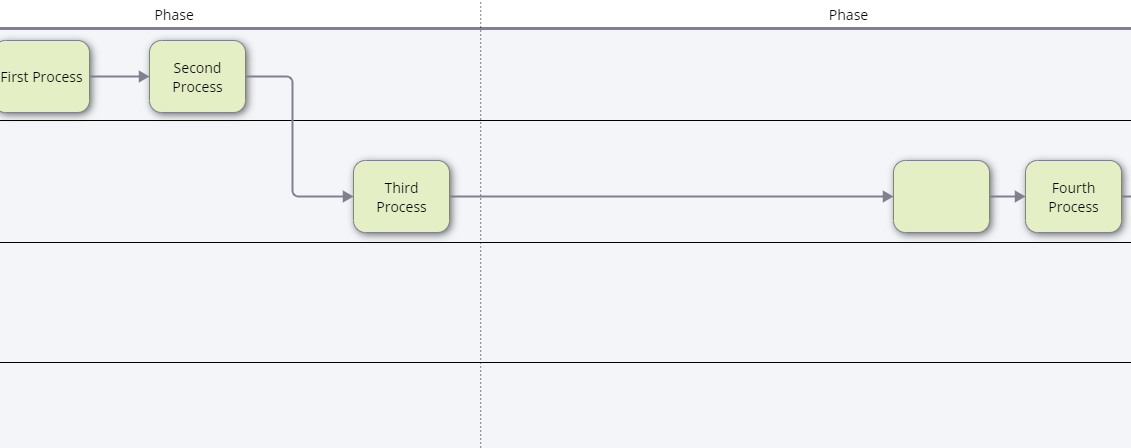
Add Phases
In addition to Pools and Lanes, diagrams can contain Phases that partition a process into groups of activities that represent logical milestones or stages within the process. These partitions can be defined for each Pool in the diagram.
Add a Phase:
-
Click the "Our Process" Pool header to display a phase line indicator

at the top of the Pool
-
Click down on the indicator and keep your left mouse button down
-
Drag the cursor left or right to position the phase border
-
Release the left-mouse button to create two phases
Here is an example: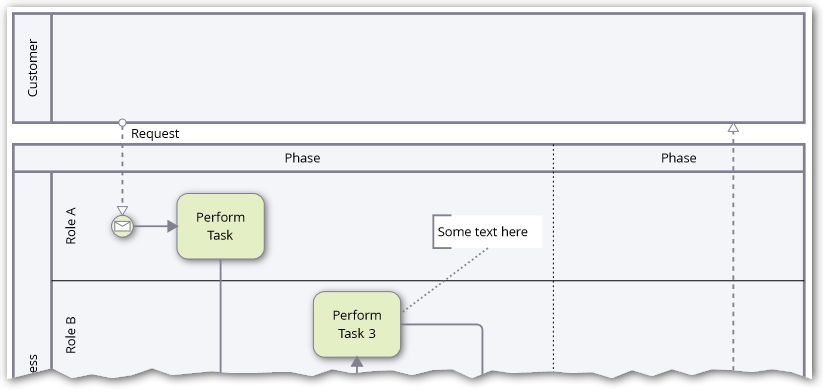
To label a Phase:
-
Click the Phase header
-
Type text to specify an appropriate label
-
Click outside the label
Move Phase borders using these methods:
-
Move shapes with Phase border: Place your cursor over the phase line and then drag and dropping to a new location.
-
Leave shapes in place: Hold the shift key down and then drag and drop the border to a new location.
To add more Phases, click a Phase header then drag and drop the Pool indicator.
To delete a Phase, click the Phase header and choose Edit > Delete or press the Delete key.
Label Lanes and Shapes with Describes Relationships
The following instructions are written for labeling swimlanes but the same steps are also used to label shapes.
Lanes are most frequently labeled with repository resources. Shapes are most frequently labeled with repository process and activity objects.
The steps assume you have these Resource objects within the repository Resources folder:
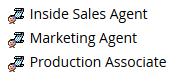
See the Adding Repository Resources topic for instructions on how to create repository resources.
Using Hints to label Lanes and Shapes
-
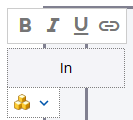
Click the "Role A" swimlane to highlight it
-
Type "In"
-
A repository icon with down arrow appears. This indicates that there are repository resource objects containing "In" in their name which you can link the Lane to.
-
Click the down arrow
-
A list of repository resources appears
iGrafx refers to the list of suggestions as "Hints":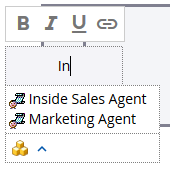
-
Click "Inside Sales Agent"
The Lane is displayed with the label and a Resource icon
indicating that the Lane is "Describing" a repository resource.
In addition, the Describes dialog is displayed showing relationships on the Described object. In this example, you can see that "Mary Gulum" is currently responsible for the "Inside Sales Agent" role: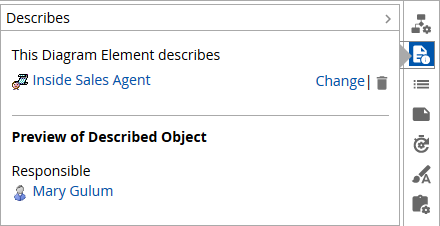
Because the Lane "Describes" the repository resource "Inside Sales Agent", if the "Inside Sales Agent" repository object is later renamed, the Lane label will be automatically updated. -
Close the Describes dialog by clicking the icon

to the right of the dialog
The association between repository objects and Lane or Shape labels is broken if you edit the label text.
-
Delete the word "Agent" in the lane label "Inside Sales Agent"
Because the label has been edited, it will no longer be automatically updated if the Inside Sales Agent" repository object is later renamed.
To repair a broken label association:
-
Select the "Inside Sales" Lane header
-
Click the Describes icon

-
In the dialog, click "Replace Now" (which is only displayed if the Lane Describes an enterprise object but the text label is not associated with the enterprise object)
-
Click the Describes icon

to close the dialog
Using Drag and drop to Label Lanes and Shapes
With your current diagram visible in the right pane:
-
In the repository tree, expand the Resources folder until the "Marketing Agent" role is visible
-
Click down on the term "Marketing Agent" and keep your left mouse button down
-
Drag the cursor over the "Role B" swimlane header
-
Release the left-mouse button
-
The "Role B" lane is renamed and a Describes relationship is created from the Lane to the repository resource.
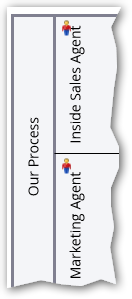
You may want to increase the height of your swimlanes to provide more room for the labels
The above steps are also used to label shapes or create new shapes in a diagram.
Using the Describes Dialog to Label Lanes and Shapes
-
Click the "Role C" swimlane to highlight it
-
Click the Describes icon

-
Click

-
In the Search field, type "Pro"
-
Click "Production Associate" and then click
-
Click the Describes icon

Custom Properties
If configured by your repository administrator, shapes can have custom properties and relationships that provide information about the task that the shape represents. By default, there are no shape custom properties.
The Custom Properties Icon 
For example, in this screenshot, the Custom Properties dialog displays four custom properties:
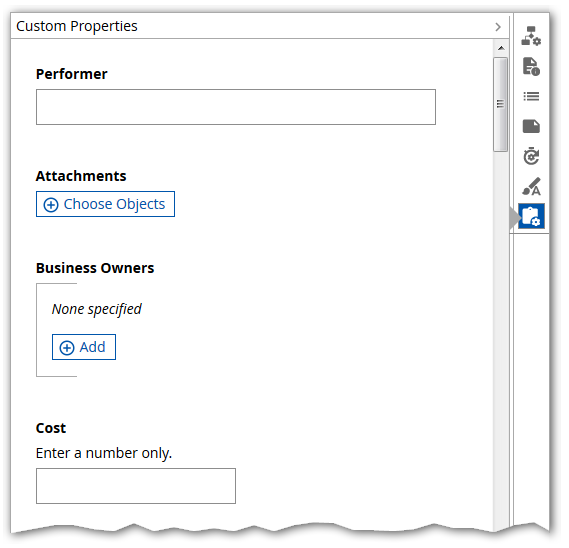
The property fields are displayed differently depending on the custom property type. In the above example:
-
Performer is a text field
-
Attachments is a link to non-iGrafx documents in the repository
-
Business Owners is one or more text fields
-
Cost is a number
When finished entering property values, click the Custom Properties Icon again.
Print
Printing is performed indirectly via Adobe PDF format. You need an Adobe program installed on your computer that can open and print PDF files.
-
Your "Our Process" example diagram should still be visible
-
In the top frame, click "File" and then choose "Print to PDF"
What happens next depends on the browser used. In Internet Explorer, a message bar similar to below will appear:
If using Internet Explorer:
-
Click Open
-
The diagram should appear in Adobe Reader or a similar tool
-
Print the diagram from Adobe Reader
BPMN Export and Import
Web diagrams can be exported and imported via BPMN XML. This is useful for diagram interchange between:
-
iGrafx and 3rd party tools
-
Separate iGrafx Platforms
-
The iGrafx Platform and iGrafx graphical Client (e.g. iGrafx FlowCharter) BPMN diagrams
Exported XML is formatted to the BPMN 2.0 specification.
-
Your "Our Process" example diagram should still be visible
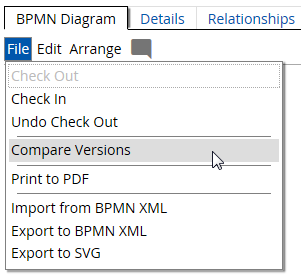
-
In the top frame, click "File" and then choose "Export BPMN XML"
-
In the subsequent dialog, save the file in an appropriate location
The "Import from BPMN XML" will import XML formatted to the BPMN 2.0 specification.
If you have an iGrafx Client tool with the XML interchange add-on installed, you can import web diagrams via the repository tree explorer (without needing to export from the web first):
-
Open the Client tool and connect to a repository
-
In the repository tree, right-click the diagram you wish to import
-
Choose "Create Document From"
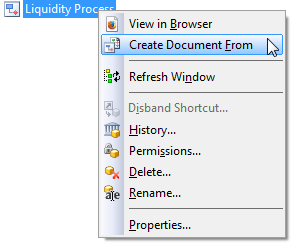
A new Client document and diagram is displayed and diagram elements are created from the imported XML. Subsequent updates to the web diagram do not affect the iGrafx Client diagram and vice versa. iGrafx Client tools with the XML interchange add-on installed can also save BPMN diagrams to BPMN 2.0 XML by specifying the "Save as type" in the "File > Save As" dialog.
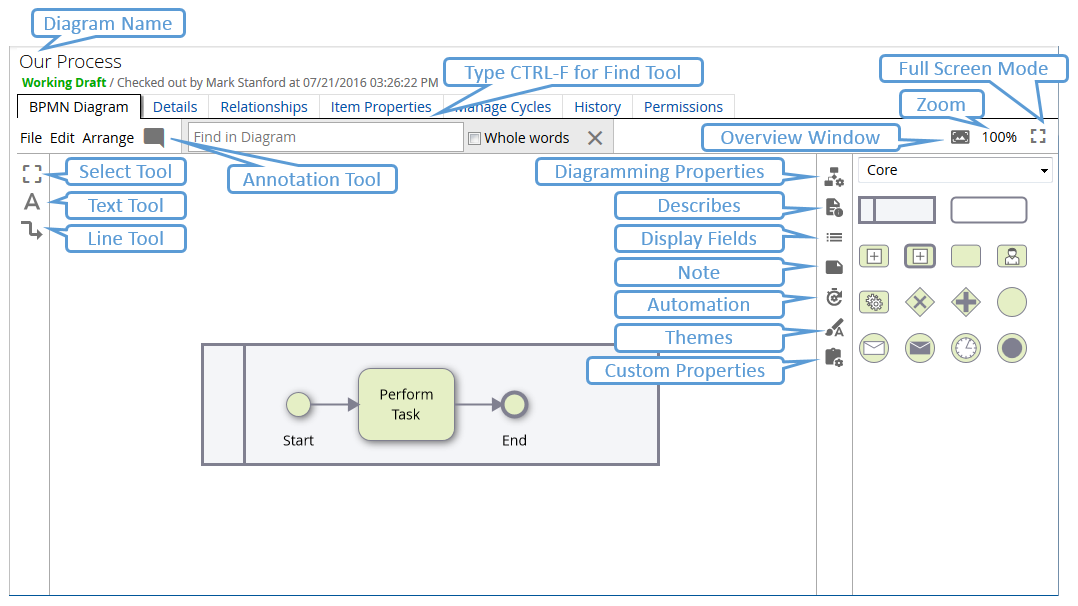
Command Summary
For convenience, here's a summary of the Web Diagramming User Interface commands Note that the user interface, including icons, may change as enhancements are added to the product.
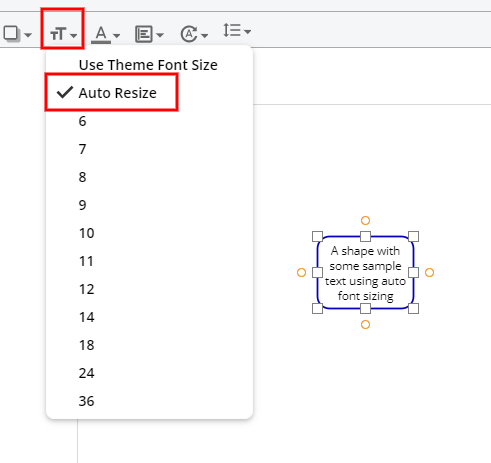
Font Sizing
Clicking the Font Size button in the top toolbar will provide options for some common font size choices. When no diagram elements are selected, this will apply to all new shapes added to the diagram. When some element(s) are selected, it will apply just to those that are selected. The Auto Resize option allows for the font size to dynamically change so as to best fit within the shape.
Format Painter
When you have a shape selected, a button for the format painter will appear in the style bar.
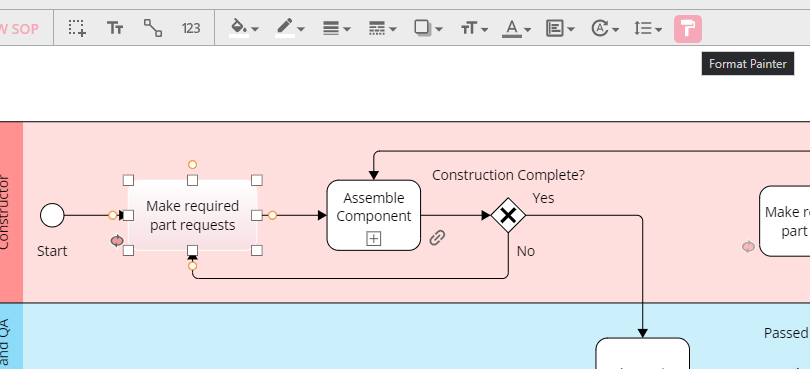
Clicking this will enter format painter mode, changing the cursor to a painter roller, and clicking other shapes will copy the style from the selected shape to another (not including text styles.) Clicking the button a second time, or hitting the esc key, will exit the format painter mode.
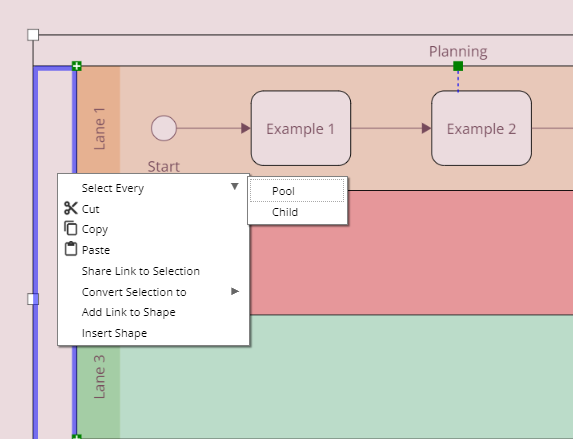
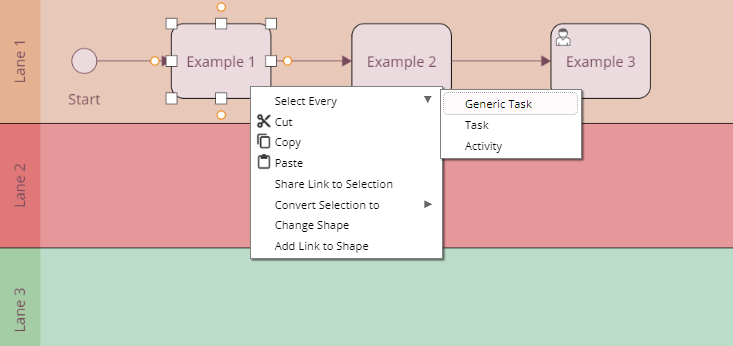
Selecting Shapes
When editing a diagram, you may need to select specific types of shapes. To do this, follow these steps:
-
Right-click on a shape of the desired type.
-
Hover over the "Select Every" options in the context menu.
-
The submenu will display various options, ranging from the most specific to the most generic.
-
Each option will select all shapes that belong to that particular type.
-
In the case of Pools and Event Sub-Processes, there is an additional option called "Child" which selects all shapes within the respective pool or sub-process.