Graphic Editor
The Graphic Editor gives Architects, care of the Shape Library, a creative canvas to design new shapes and enhance existing shapes imported from SVG files. Using the pen tool, or ellipse and rectangle tools, you can draw outlines of shapes with ease. Selecting existing lines in the shape reveals anchor points that can be selected, dragged, and adjusted. Shape elements can also be layered for increased intricacy and depth.

Additionally, the Graphic Editor allows you to lock in formatting of shape elements, such as specifying thickness, style and color of strokes, as well as the fill, colors, patterns and transparency. Locking in formatting gives the shape creator the ability to include meaningful formatting that the diagram creator cannot change, while still giving that user the freedom to follow a diagrams overall theme.

Example. Red heart locked in using the Graphic Editor. Diagram author can still change the overall fill color
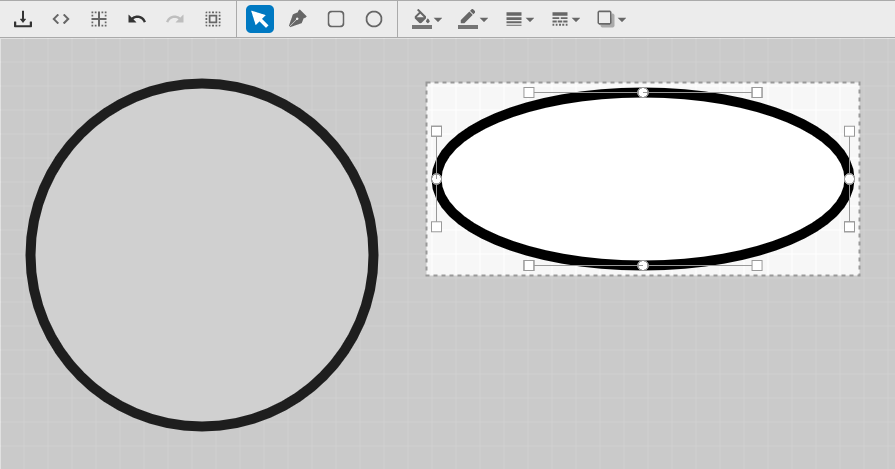
Bounding boxes
When a shape is selected, a bounding box appears around the shape that can be manipulated to change the size and proportions of the selection. You can resize in increments with the grid, or smoothly without. Resizing shapes maintains their proportions when you hold either the Ctrl or Shift keys.
Multiple paths and shapes
Combine multiple separate paths into one, multi-path shape. Those multi-path shapes can also be ungrouped to their separate paths again with ease. When you select multiple shapes, right-click provides arrangement and grouping options. Alternatively you can quickly reorder shapes using hotkeys.
Reporting
We have vastly improved reporting performance. This includes refinements to how report results are generated. Report authors need to consider the target audience for their report, and select Approved version or Latest Version.
More Information...
Describes Preview
Historic compare
Our work surrounding historical data and the presentation of that data continues. The Describes Preview panel presents how the described object looked when the diagram was approved compared to how it looks now. You can also inspect the delta of the values displayed for two version of a diagram.
Frozen object names
Historic names of described objects now appear in a checked-in, frozen view in the Describes Preview. If a described object changes after diagram check-in, the diagram will freeze the original name of the object. This also works with multilingual, keeping the historic names of processes in other languages.
New Custom Properties section
The Custom Properties on the web diagram object itself now shows in a new custom properties section. This section provides a detailed list that shows tailored information at the diagram object level.
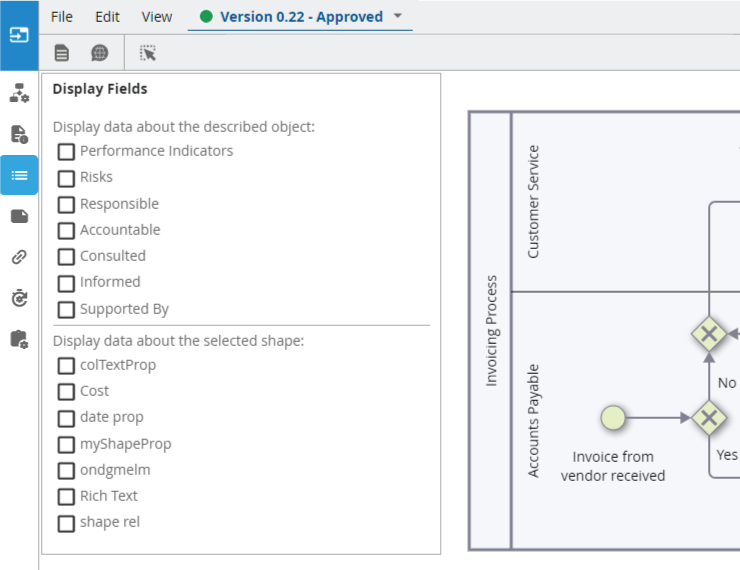
Display Fields
Authors can now included Diagram Element Custom Properties in their diagrams, care of the Display Fields panel.