Work with dashboards
A dashboardDashboard A configurable view in Process360 Live that aggregates KPIs, charts, and filters across one or more processes for stakeholders to monitor performance. gives you an at-a-glance view of status and performance. Each dashboardDashboard A configurable view in Process360 Live that aggregates KPIs, charts, and filters across one or more processes for stakeholders to monitor performance. belongs to one repository, and the objects its gadgets show come from that repository. This page shows how to view and switch dashboardsDashboard A configurable view in Process360 Live that aggregates KPIs, charts, and filters across one or more processes for stakeholders to monitor performance., set your default, create your own, and arrange its gadgets.
Prerequisites
- Viewing a dashboardDashboard A configurable view in Process360 Live that aggregates KPIs, charts, and filters across one or more processes for stakeholders to monitor performance. requires the View item permission on it; creating or changing one requires Create on the destination folder and Modify on the dashboardDashboard A configurable view in Process360 Live that aggregates KPIs, charts, and filters across one or more processes for stakeholders to monitor performance..
- Adding the Chart, Table, and Performance Tree gadgets requires a license that includes performance gadgets — see the License capability matrix. The other gadget types have no license gate.
Steps
View and switch dashboards
- Select DashboardDashboard A configurable view in Process360 Live that aggregates KPIs, charts, and filters across one or more processes for stakeholders to monitor performance. in the navigation rail. The DashboardDashboard A configurable view in Process360 Live that aggregates KPIs, charts, and filters across one or more processes for stakeholders to monitor performance. area opens on your default dashboardDashboard A configurable view in Process360 Live that aggregates KPIs, charts, and filters across one or more processes for stakeholders to monitor performance. — your own default if you set one, otherwise the dashboardDashboard A configurable view in Process360 Live that aggregates KPIs, charts, and filters across one or more processes for stakeholders to monitor performance. your administrator chose, otherwise the first one you can view.
- To switch, pick another dashboardDashboard A configurable view in Process360 Live that aggregates KPIs, charts, and filters across one or more processes for stakeholders to monitor performance. from the drop-down next to the dashboardDashboard A configurable view in Process360 Live that aggregates KPIs, charts, and filters across one or more processes for stakeholders to monitor performance. name. The list covers every repository you can use, grouped by repository name.
Opening a dashboardDashboard A configurable view in Process360 Live that aggregates KPIs, charts, and filters across one or more processes for stakeholders to monitor performance. from another repository doesn't change the repository you're working in. That changes only when you follow a link out of the dashboardDashboard A configurable view in Process360 Live that aggregates KPIs, charts, and filters across one or more processes for stakeholders to monitor performance. into the Model area.
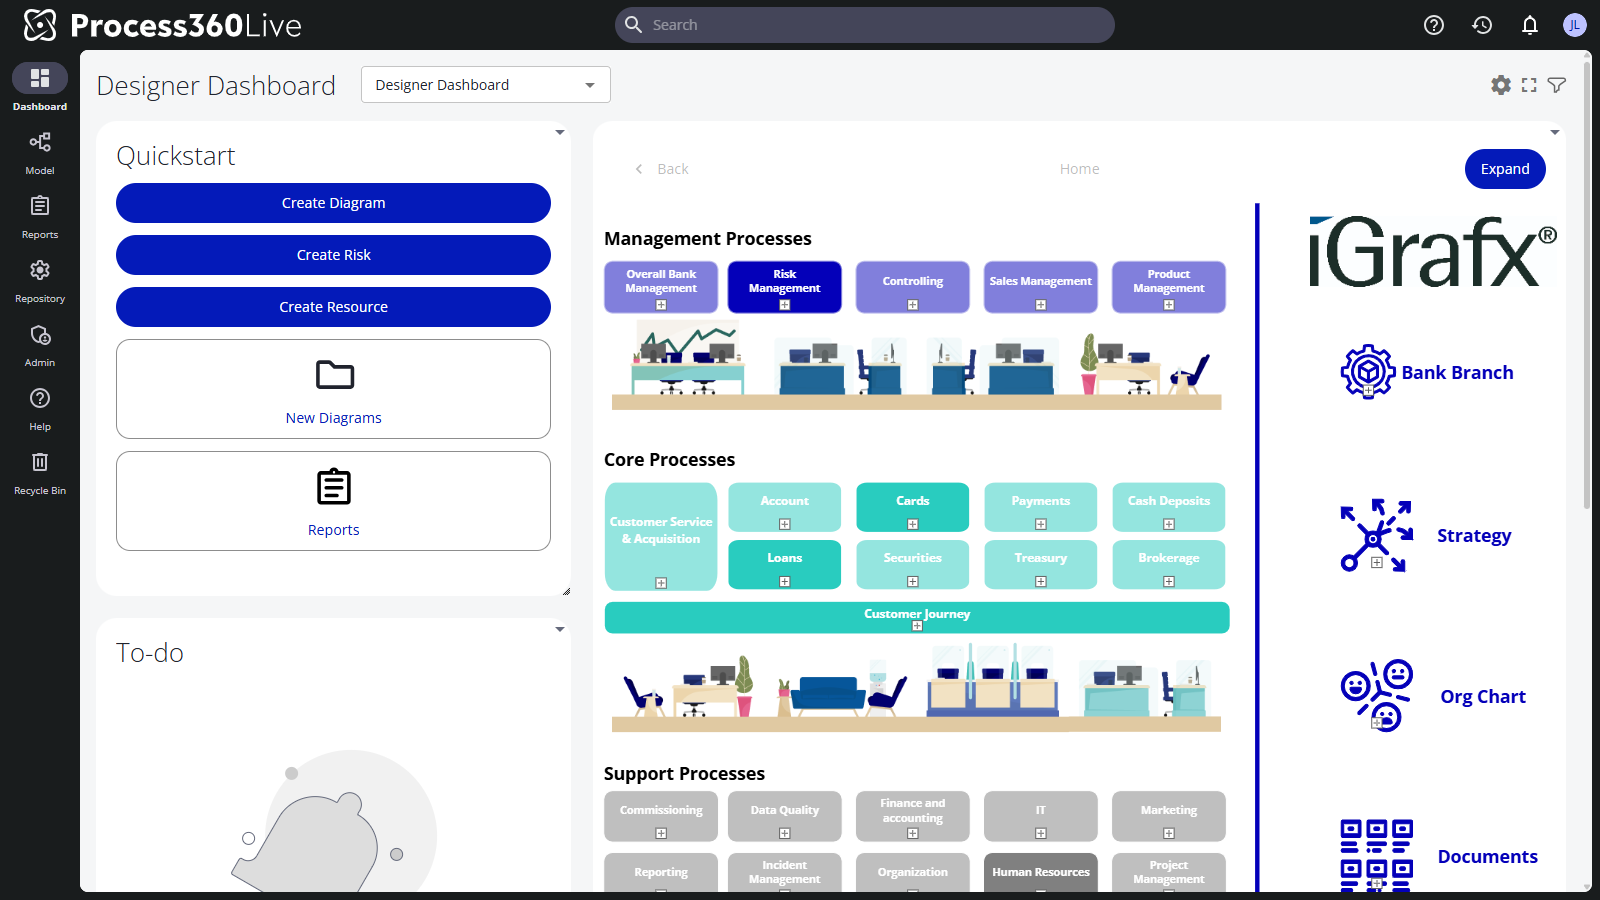
The toolbar also offers Enable Full Screen and a filter toggle (see below). A dashboardDashboard A configurable view in Process360 Live that aggregates KPIs, charts, and filters across one or more processes for stakeholders to monitor performance. is also a repository item: in the Model area it lives in the DashboardsDashboard A configurable view in Process360 Live that aggregates KPIs, charts, and filters across one or more processes for stakeholders to monitor performance. folder, and its page shows the same gadgets plus a View in DashboardDashboard A configurable view in Process360 Live that aggregates KPIs, charts, and filters across one or more processes for stakeholders to monitor performance. Area link.
Set your default dashboard
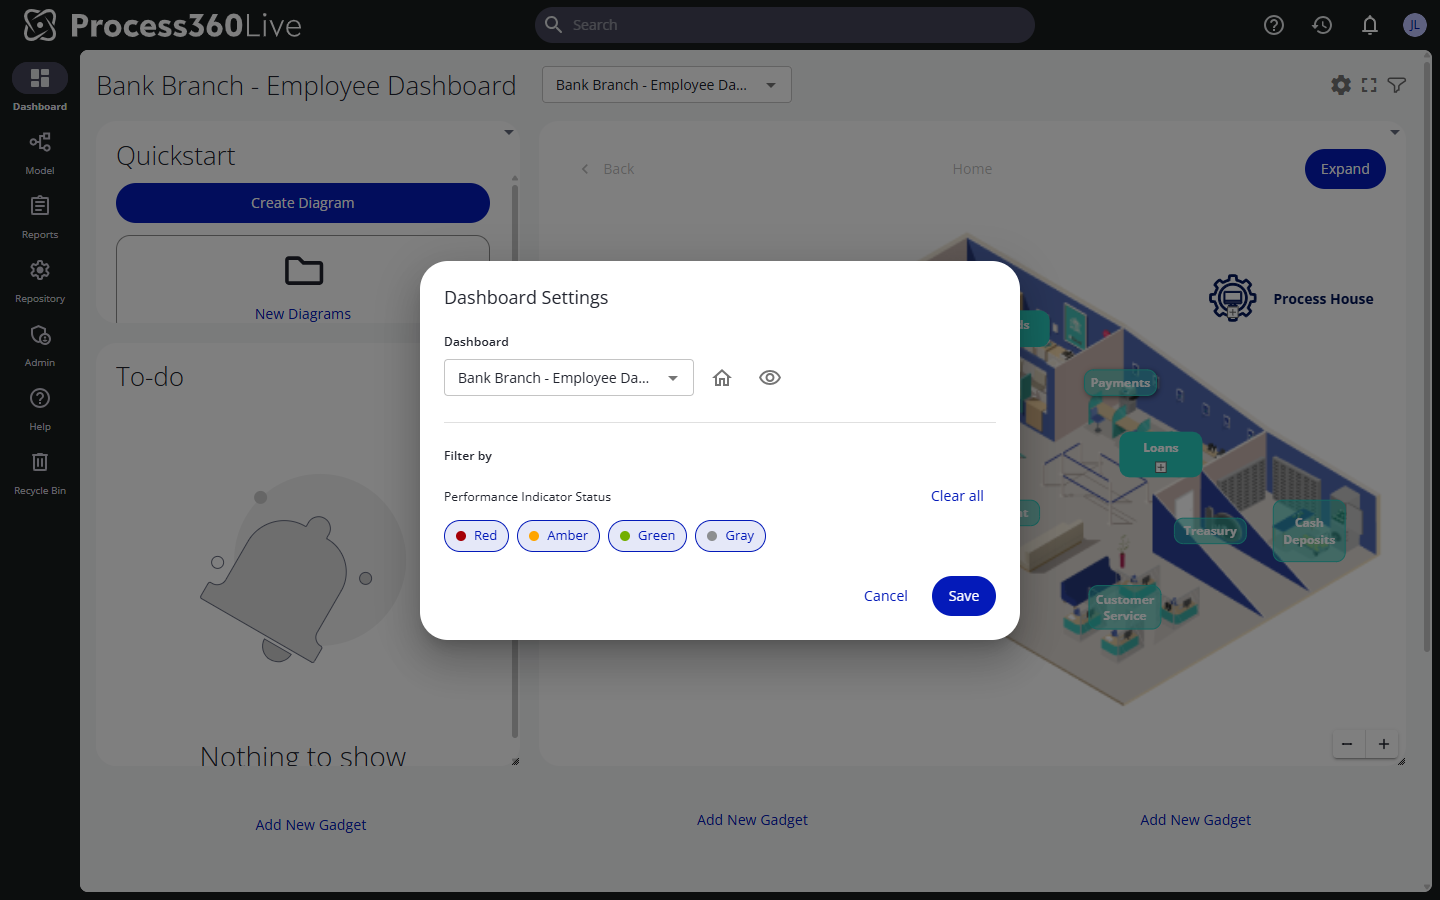
- In the DashboardDashboard A configurable view in Process360 Live that aggregates KPIs, charts, and filters across one or more processes for stakeholders to monitor performance. area, select the settings gear. The DashboardDashboard A configurable view in Process360 Live that aggregates KPIs, charts, and filters across one or more processes for stakeholders to monitor performance. Settings dialog opens.
- Pick the dashboardDashboard A configurable view in Process360 Live that aggregates KPIs, charts, and filters across one or more processes for stakeholders to monitor performance. in the DashboardDashboard A configurable view in Process360 Live that aggregates KPIs, charts, and filters across one or more processes for stakeholders to monitor performance. drop-down, click the outline home icon, tooltip Set Default, then Save. The DashboardDashboard A configurable view in Process360 Live that aggregates KPIs, charts, and filters across one or more processes for stakeholders to monitor performance. area now opens on this dashboardDashboard A configurable view in Process360 Live that aggregates KPIs, charts, and filters across one or more processes for stakeholders to monitor performance. for you.
To clear your default, pick the dashboardDashboard A configurable view in Process360 Live that aggregates KPIs, charts, and filters across one or more processes for stakeholders to monitor performance. that is your default, click the filled home icon, tooltip Remove Default, then Save.
Your default is personal: it takes precedence over the dashboardDashboard A configurable view in Process360 Live that aggregates KPIs, charts, and filters across one or more processes for stakeholders to monitor performance. your administrator chose, and it doesn't change what other users see. You have one default in total, not one per repository, so setting a default in another repository replaces it.
Filter what the dashboard shows
In the same DashboardDashboard A configurable view in Process360 Live that aggregates KPIs, charts, and filters across one or more processes for stakeholders to monitor performance. Settings dialog you can filter the dashboardDashboard A configurable view in Process360 Live that aggregates KPIs, charts, and filters across one or more processes for stakeholders to monitor performance.'s content for your view:
- Performance Indicator Status — show only indicators in the checked states (Red, Amber, Green, Gray).
- My Assignments — show only content related to work you're assigned to, optionally narrowed to one RACI role (Responsible, Accountable, Consulted, or Informed). This option appears only if an administrator has mapped your user account to a resource; without that mapping it's hidden (see View your assignments).
Click Save; the filter toggle in the toolbar turns the saved filter on and off.
Create a dashboard
- In the Model area, select the DashboardsDashboard A configurable view in Process360 Live that aggregates KPIs, charts, and filters across one or more processes for stakeholders to monitor performance. folder (or a folder inside it), then Add Object, and choose the type DashboardDashboard A configurable view in Process360 Live that aggregates KPIs, charts, and filters across one or more processes for stakeholders to monitor performance..
- Name the dashboardDashboard A configurable view in Process360 Live that aggregates KPIs, charts, and filters across one or more processes for stakeholders to monitor performance.. Under Gadgets and Layout, keep Empty or choose Copy From Existing DashboardDashboard A configurable view in Process360 Live that aggregates KPIs, charts, and filters across one or more processes for stakeholders to monitor performance. and pick the source dashboardDashboard A configurable view in Process360 Live that aggregates KPIs, charts, and filters across one or more processes for stakeholders to monitor performance. — by typing its name or browsing with Show Tree. Copying brings over the source's gadgets and layout.
- Click Finish. The new dashboardDashboard A configurable view in Process360 Live that aggregates KPIs, charts, and filters across one or more processes for stakeholders to monitor performance. opens, ready for gadgets.
Add and arrange gadgets
-
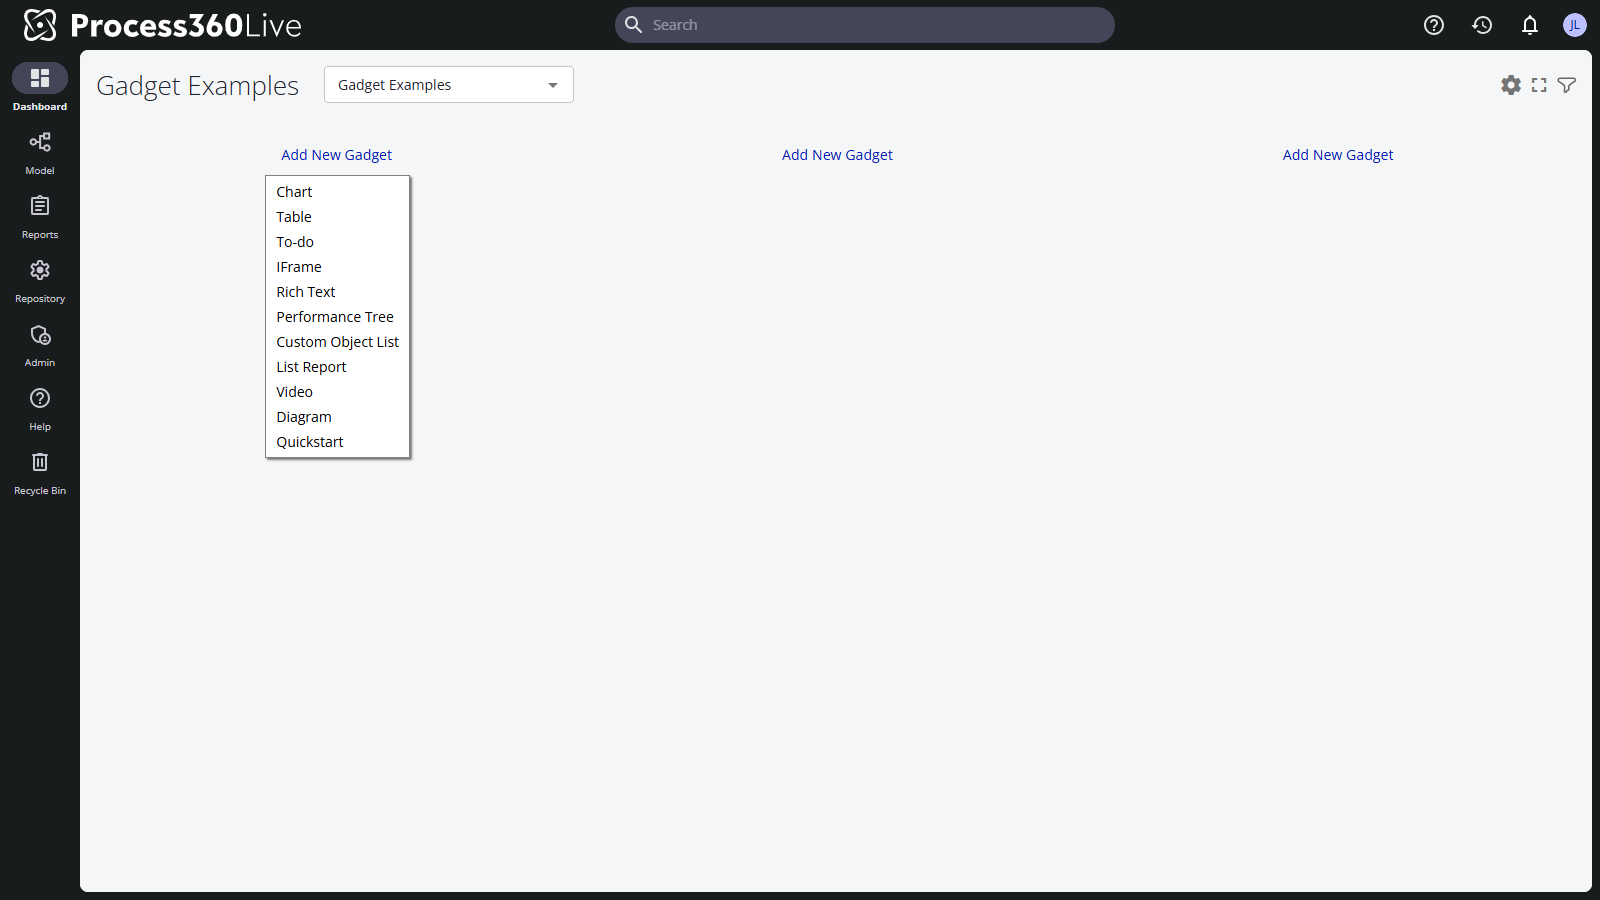
On the dashboardDashboard A configurable view in Process360 Live that aggregates KPIs, charts, and filters across one or more processes for stakeholders to monitor performance., click Add New Gadget in a free space and pick a gadget type — see Dashboard gadgets for what each one shows.
-
Configure the gadget if it asks for it — for example, a Chart gadget asks you to pick the chart to display, and an IFrame gadget asks for a URL. The To-do gadget needs no setup.
-
Drag a gadget's header to move it, or drag its lower-right corner to resize it. Changes save as you make them.
Verify
Open DashboardDashboard A configurable view in Process360 Live that aggregates KPIs, charts, and filters across one or more processes for stakeholders to monitor performance. in the navigation rail: your dashboardDashboard A configurable view in Process360 Live that aggregates KPIs, charts, and filters across one or more processes for stakeholders to monitor performance. appears in the switcher under its repository, and once you've set it as your default it's the one that opens first.
Related
- Dashboard gadgets — what each gadget type shows
- Create a chart and Create a table — the objects the Chart and Table gadgets display
- Act on your to-do items — the list behind the To-do gadget