Process metrics
Process metrics let you attach numeric data to diagram shapes through custom properties, then analyze it in the diagram with the Metrics panel, heatmaps, the Path Explorer, and the Metrics Explorer.
Prerequisites
- The diagram checked out to you.
- Custom properties to hold the data — either repository-defined or diagram-defined.
Steps
Add metric data
- Select a shape (or skip this to add a value to the diagram itself).
- Open the Custom Properties panel.
- Find the property and enter a value.
Open the Metrics panel
Select Apps in the top-right toolbar, then Metrics — or click the Metrics Panel button in the view toolbar. The panel sits at the bottom of the diagram: metric names and controls on the left, per-shape values in the center, and totals on the right.
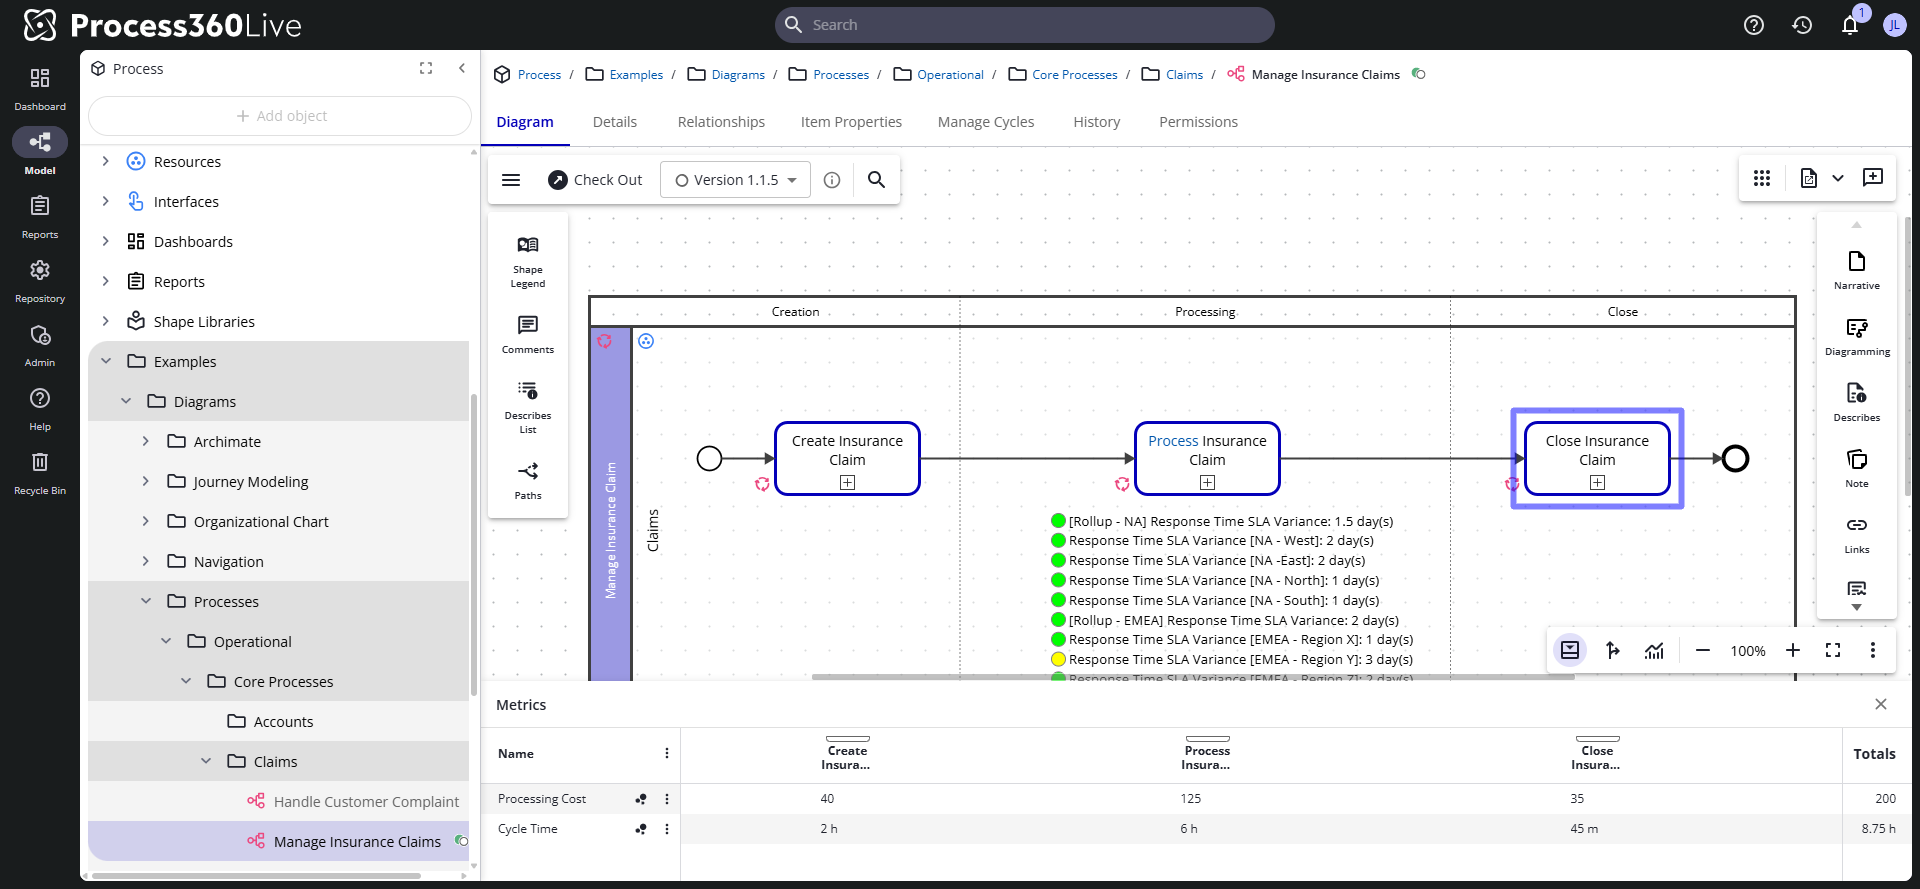
- Choose which metrics show — select Add Metrics in the panel (or the three-dot menu → Show or hide metrics), pick the metrics, and Save.
- Totals — shown on the right. For percent metrics the total is the product of the values; for all others it's the sum.
- Format a metric — three-dot menu next to the metric name → Format metrics.
Color shapes with a heatmap
- Three-dot menu next to the metric → Heatmap coloring.
- Edit the value ranges and colors; Add values between creates a new bucket; Save.
- Click the heatmap button next to the metric to enable it.
Analyze paths with the Path Explorer
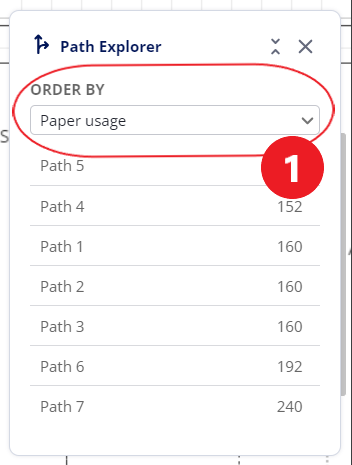
Select Path Explorer in the top toolbar. It lists the diagram's paths with the summed metric values along each. Selecting a path highlights it and filters the Metrics panel to that path. Add a path from the Paths panel; use Order by to sort paths by a metric's total.
Aggregate with the Metrics Explorer
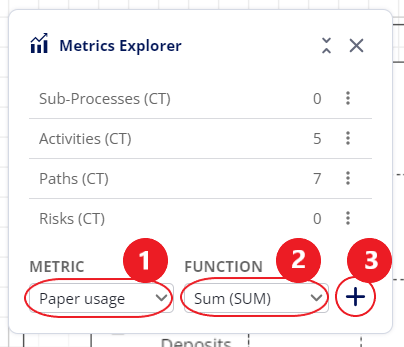
Select Metrics Explorer in the top toolbar to analyze all the diagram's metrics. Pick a metric and, for shape metrics, an aggregation function, then add it:
- Sum — sums all values for the metric.
- Average — averages all values for the metric.
- Other functions such as standard deviation are also available.
Some property types can't be summarized (for example a Selection List) and don't appear in the list. Use the three-dot menu next to a metric to Format or Remove it.