Run a simulation
Create a simulation project, run it, and keep the results.
Prerequisites
- Simulation enabled for the platform — it's on by default; see Simulation.
- Creating a simulation project, editing simulation properties, and saving results require a license that can create and edit web diagrams — see the license capability matrix. Running an existing project and exporting its results to a file work for anyone who can open it.
- A network that allows WebSocket connections.
Steps
Create a simulation project
Start from scratch:
- In the repository tree, go to the folder that should hold the project.
- Select Add object and choose the type Simulation Project. The project is created with an empty diagram inside it — open the diagram and draw the process.
Or start from an existing diagram:
- Open the diagram and make sure it's checked in — the simulation copies the last checked-in version, so changes made since the last check-in don't carry over.
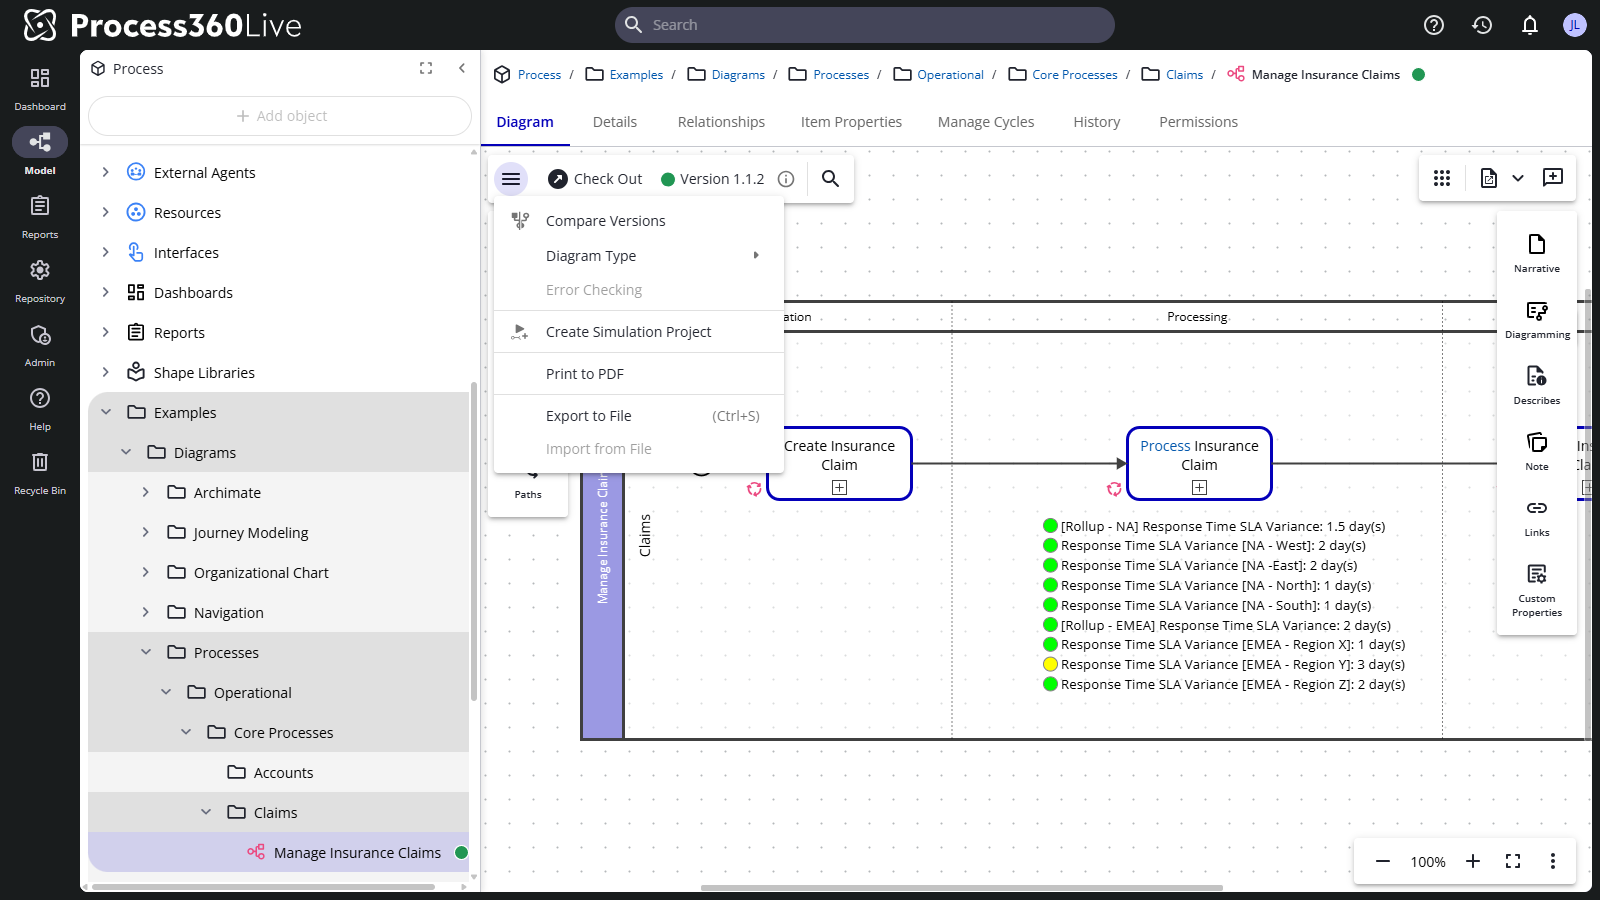
- Select Main Menu and choose Create Simulation Project. A new project named after the diagram is created, holding a copy of it.
Define the simulation behavior
- In the project's diagram, click Properties in the simulator toolbar. The Simulation Properties window opens.
- With nothing selected, it shows model-level properties — run length, resources, variables, schedules, scenarios. See Simulation properties.
- With a shape selected, it shows that shape's properties — generator, task duration, required resources, outputs. See Simulation shape properties.
- With a connector line selected, it shows the transition's duration and its variable assignments, which run as the case enters or leaves the line.
- Make sure at least one shape generates cases — select the shape where work enters the process, and on the Generator tab turn on Generate Here.
Fix problems
If the model has invalid parameters, the Simulation Problems dialog lists them, and a Problems button appears in the simulator toolbar to reopen it. The dialog opens on its own only when there's an error — warnings wait in the dialog until you open it.
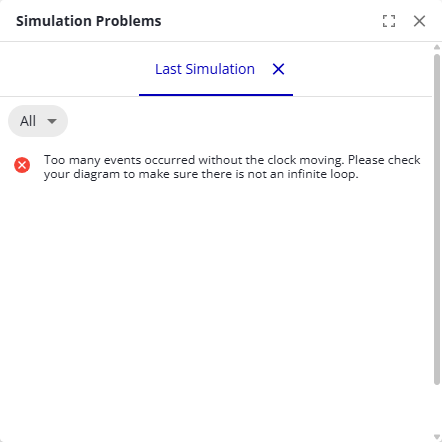
- Items with a red error icon stop the simulation — you can't run while current errors exist.
- Items with a yellow warning icon let the run proceed but can produce unexpected results.
- Most items carry a navigation icon or link that takes you to the affected shape or property. Some model-wide ones (for example, no active generators in a process) have nothing to navigate to.
- The Current tab lists problems in the model right now; the Last Simulation tab lists what the previous run reported.
Run the simulation
Click Run in the simulator toolbar. The run executes for the time or case count set on the Run Setup tab, and the Simulation Statistics window opens with the results.
To run every defined scenario in one go, use Run all scenarios — see Simulation properties.
Watch it in trace mode
Click Run in traceTrace The ordered sequence of activities executed for a single case. Grouping cases by identical traces produces variants. mode to watch cases move through the diagram instead of jumping straight to results.
- Play, Pause, Step, Stop, and Finish control playback; the Speed slider runs from slow to fast.
- The CasesCase A single instance of a process — for example, one customer order, invoice, or support ticket. An event log groups events by case ID. and Resources panels show what each case and resource is doing at the current moment. The CasesCase A single instance of a process — for example, one customer order, invoice, or support ticket. An event log groups events by case ID. panel shows each case's own CaseCase A single instance of a process — for example, one customer order, invoice, or support ticket. An event log groups events by case ID.-scope variable values only. It does not show the values held by that case's parent or base case. To watch those, assign
Parent.<variable>orBase.<variable>to a CaseCase A single instance of a process — for example, one customer order, invoice, or support ticket. An event log groups events by case ID.-scope variable of the case in a variable assignment, and the panel shows the copied value. - To pause automatically when a case reaches a shape, set a pausepoint on that shape.
Save or export the results
When a run finishes, the Simulation Statistics window offers:
- Save Results Object — saves the run as a Simulation Results object inside the simulation project, named whatever you enter (with an optional summary). Saved runs are what the project comparison view reads.
- Export results — downloads the statistics as an Excel or JSON file. All statistics are always included, regardless of which columns are visible.
- Export case log — available when Log cases was on for the run; downloads per-case activityActivity A named step in a process (e.g. "Approve Invoice"). Each event in an event log records one activity occurrence for one case. data as Excel or JSONL, ready for analysis in a spreadsheet or Process MiningProcess Mining A discipline that uses event data recorded by enterprise systems to discover, monitor, and improve real business processes — revealing how work actually flows rather than how it was designed..
An Excel download runs as a background job and starts on its own when the job finishes. Track it in the Status Log, where it appears as Simulation Statistics Export or Simulation CaseCase A single instance of a process — for example, one customer order, invoice, or support ticket. An event log groups events by case ID. Log Export. JSON and JSONL downloads start straight away.
CaseCase A single instance of a process — for example, one customer order, invoice, or support ticket. An event log groups events by case ID. identifiers change when a case splits into a family. For case-log analysis that needs one stable ID per original case, create a CaseCase A single instance of a process — for example, one customer order, invoice, or support ticket. An event log groups events by case ID.-scope variable (for example CaseID) and assign it at the generator shape from a Model-scope counter you increment on each generated case.

Compare runs
- Save the runs you want to compare into the project.
- Open the Simulation Project object. Its Simulation Project tab lists every saved run with key statistics, and Add Statistic lets you add columns. Density, above the table, sets the row height; the browser remembers your choice.
- Pick the run to measure against in the Baseline Run dropdown. Each other run shows its percentage change from the baseline, colored green or red with an up or down arrow. Hover over a column header and open its menu (three vertical dots) to tell the comparison whether higher or lower values are better. The same menu changes the decimal places or removes the statistic.
- Select Compare with baseline run on a run to see what changed in the diagram between the two runs, or Download comparison table to export the comparison.
Verify
- The run finishes and the Simulation Statistics window shows case counts and times on its Processes and Activities tabs.
- A saved run appears as a Simulation Results object inside the simulation project, and on the project's Simulation Project tab.
Troubleshooting
- Simulation makes no progress
- Simulation fails with a WebSocket connection error
- Resource utilization looks lower than expected