Use a performance tree
Add the Performance Tree gadget to a dashboardDashboard A configurable view in Process360 Live that aggregates KPIs, charts, and filters across one or more processes for stakeholders to monitor performance. to watch a hierarchy of Performance Indicators as traffic lights, with each folder showing the aggregated color of what's inside it.
Prerequisites
- The PRC (Performance, Risk and Control) Module. Viewing performance gadgets is open to any license with the module; adding or editing them requires a license that can create and edit PRC gadgets — see the License capability matrix.
- Modify permission on the dashboardDashboard A configurable view in Process360 Live that aggregates KPIs, charts, and filters across one or more processes for stakeholders to monitor performance. you add the gadget to.
- Performance Indicators with rating systems and data — see Create a performance indicator.
Steps
Add the gadget
- Open the dashboardDashboard A configurable view in Process360 Live that aggregates KPIs, charts, and filters across one or more processes for stakeholders to monitor performance. from the DashboardDashboard A configurable view in Process360 Live that aggregates KPIs, charts, and filters across one or more processes for stakeholders to monitor performance. area.
- Click Add New Gadget in a free spot, and choose Performance Tree from the gadget list.
- The gadget shows Gadget not yet configured — click Configure Now.
Configure it
- Optionally type a Title for the gadget.
- Under Objects, click Add objects.
- In the Choose Objects dialog, search by name — or turn on Show Tree and pick from the repository tree, which is the safer choice when several items share a name. Select the folders or Performance Indicators that form the roots of the tree; you can pick more than one. Click Confirm selection.
- The Preview pane shows the resulting tree. Click Save Changes.
To reconfigure or remove the gadget later, open the menu at the gadget's top-right corner and choose Configure or Delete.
Read the tree
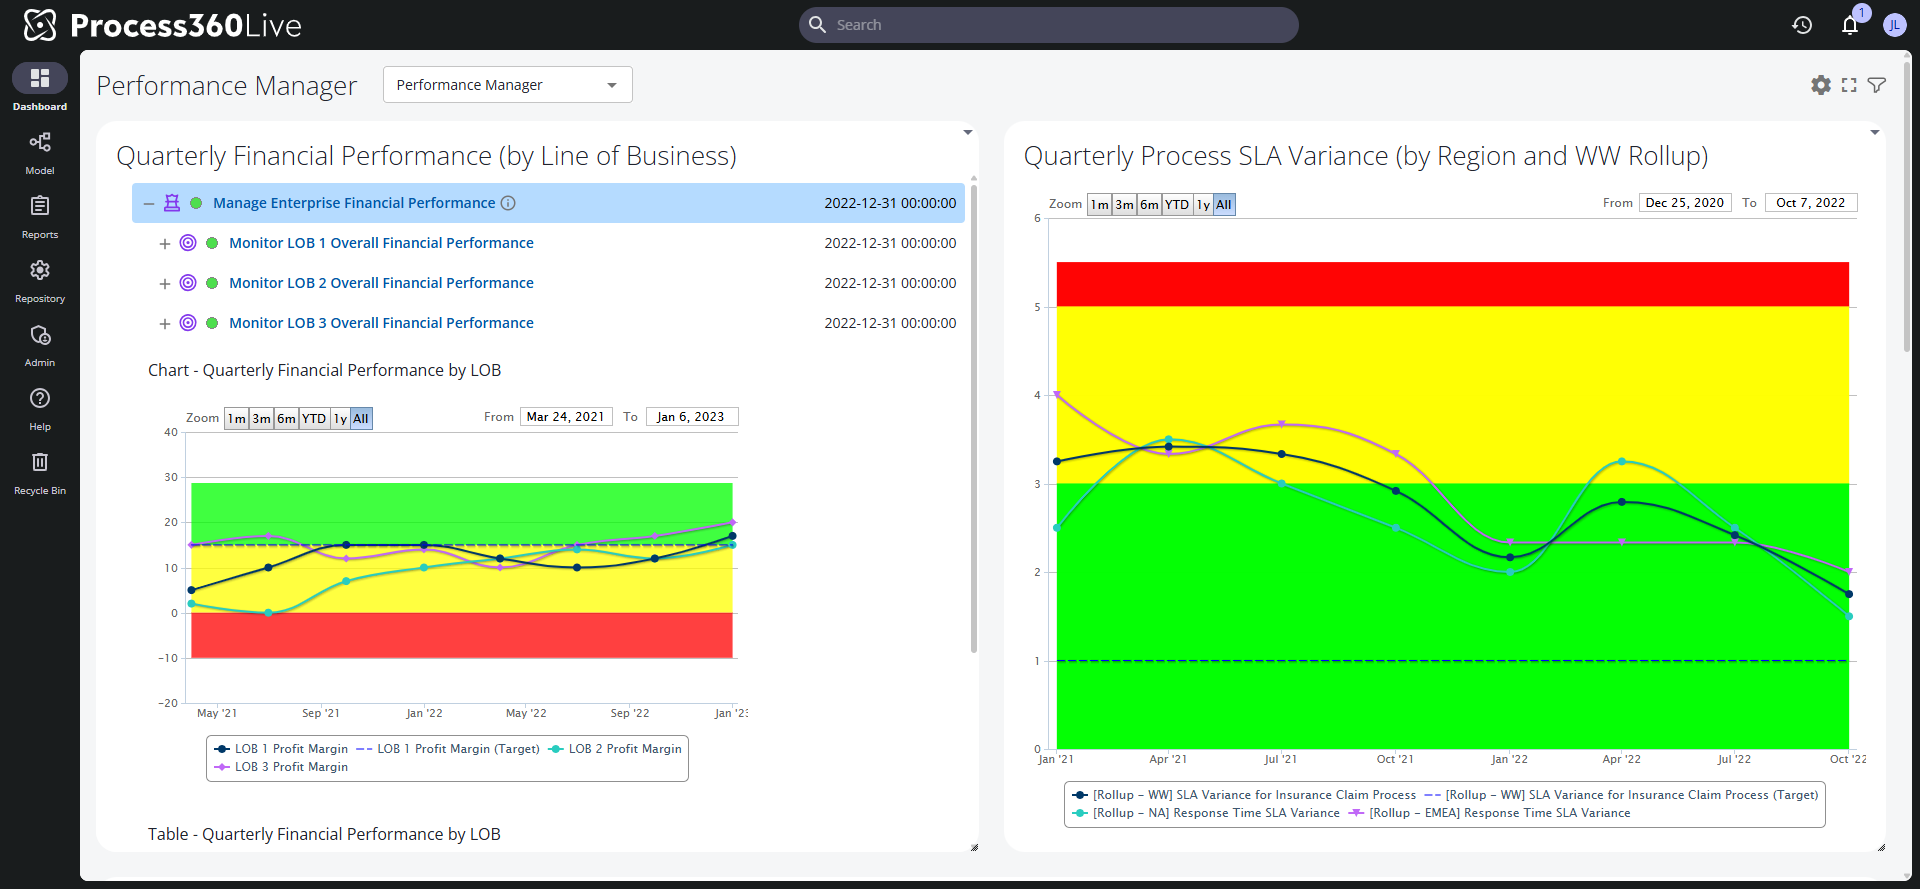
- Each row shows the item's traffic light, its name with the current value, a trend arrow, and the date of its newest data point.
- A folder's color is the weighted aggregate of the rated indicators inside it — see How ratings aggregate. Unrated indicators and indicators weighted None show gray and don't affect the aggregate.
- Expand a node to see what's inside. Charts and Tables that live in an expanded folder render inline in the tree, and each indicator row expands to a Performance Indicator Details table with its unit, weighting, and other settings.
- The tree only contains items you have permission to view, and the aggregated colors only count those items — so users with different permissions can see different colors for the same folder.
- To filter the whole dashboardDashboard A configurable view in Process360 Live that aggregates KPIs, charts, and filters across one or more processes for stakeholders to monitor performance. by indicator status, open the dashboardDashboard A configurable view in Process360 Live that aggregates KPIs, charts, and filters across one or more processes for stakeholders to monitor performance.'s settings and use Filter by Performance Indicator Status to show only Red, Amber, Green, or Gray items.
Verify
The tree shows your selected objects with their traffic lights. If the gadget reports No data to currently display, check that the configured objects are the ones holding your indicators — names can repeat across the repository, so confirm the pick with Show Tree.