Create a table
Add a Table object that shows Performance Indicator data side by side in columns, with optional derived columns and limit, target, and trend markers.
Prerequisites
- The PRC (Performance, Risk and Control) Module, and a license that can create and edit Charts and Tables — see the License capability matrix.
- At least one Performance Indicator with data — see Add performance indicator data.
Steps
Add the Table object
- In the repository tree, select the folder or object where the table belongs. You can create a Table in most places except the Risk Catalog.
- Click Add object, choose Table, type a Name, and click Finish.
Add Performance Indicators
- On the table's Table tab, click Edit Table.
- Click Add Performance Indicator, pick the indicators in the Choose Objects dialog, and click Confirm selection. Each indicator becomes a column.
- Optionally click Add Derived PI to add a computed column: name it and choose the operation — Sum, Average, Max, Min, or Median. The derived column applies the operation across the other columns' values for the same date or category.
- Each row in the editor lists the indicator's data type and rating system, a Color picker for the column background, and controls to delete or reorder it.
Configure the columns and the table
Changes in the editor apply as you make them; click OK when you're done.
Select an indicator's name in the editor to configure its column:
- Display — Date grouping buckets the rows (daily through yearly; the grouping applies to every indicator in the table), Value grouping condenses each bucket (Average, Open, High, Low, Close, or Sum), Rounding trims decimals, and Rollup type adds a summary row for the column (Sum, Average, Max, Min, or Median). You can also hide the column, give it a custom display name, show the unit in the header, and set the text and header alignment.
- Limits — Show limits adds a traffic-light marker to each value, colored by the indicator's limits; gray when no limit covers the value.
- Target — Show target adds a marker showing each value against the indicator's target.
- Trend — Show trend adds a green up arrow, red down arrow, or gray circle for a flat trend next to each value.
The editor's Display tab holds table-wide options: the alignment of the date column, the label of the summary row, how much history to show, the date column's background color, and an auto-refresh interval (Every 5 seconds to Every 15 minutes).
Verify
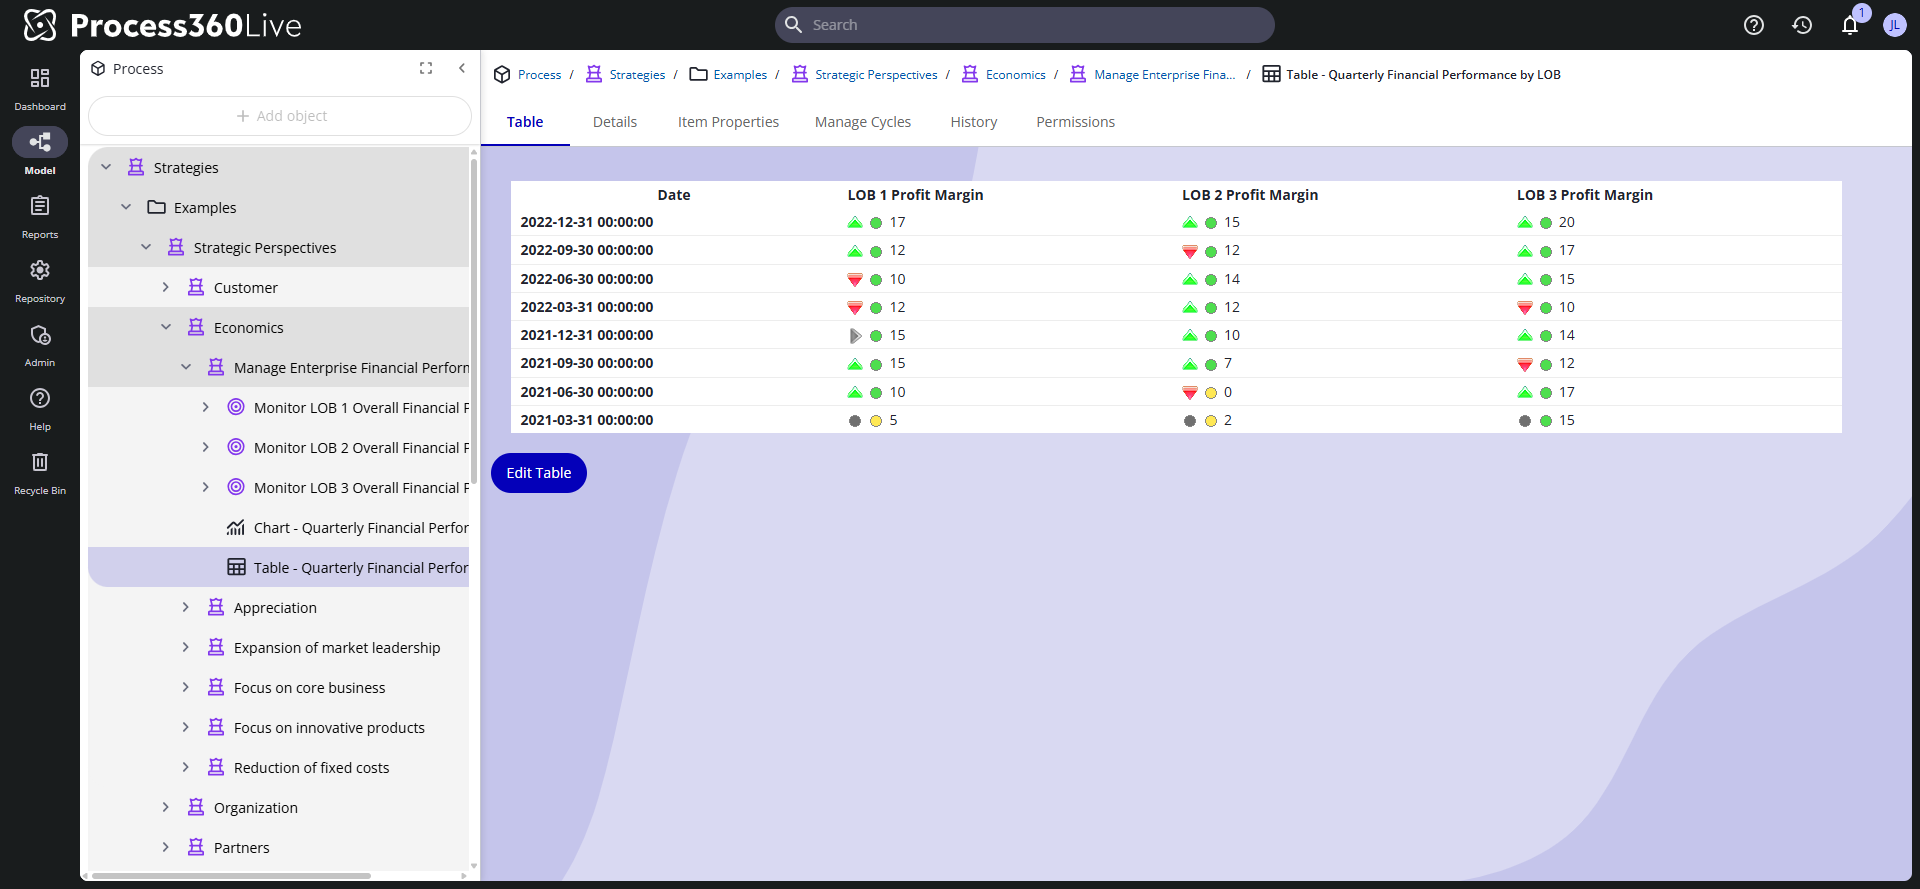
Open the table's Table tab. The columns show one row per date or category — grouped if you set a date grouping — with the derived column computed across them.
Related
- Performance management
- Create a performance indicator
- Add performance indicator data
- Create a chart
- Use a performance tree — tables placed in a tracked folder render inside the gadget