Add performance indicator data
Enter data for a Performance Indicator on its Data tab — by hand, by rolling up other indicators, or by collecting a nightly report result.
Prerequisites
- The PRC (Performance, Risk and Control) Module, and a license that can edit PRC data values — see the License capability matrix.
Steps
Open the Performance Indicator and select the Data tab. What the tab offers depends on the Type of Data chosen on the Settings tab (Create a performance indicator). Data for every type persists in the repository, so switching the type later doesn't lose what you entered here.
Time-based data
For Time-based (Numeric) and Time-based (Text) indicators:
- Select the Date field and pick a date. The time defaults to 00:00:00; edit it in the field if the time of day matters.
- Enter the Value (number) — or, for a text indicator, the Value (text).
- Click Add data point. The point appears at the top of the list.
Use Edit or Delete next to a data point to change or remove it. Download data exports the series.
Category-based data
For Category-based indicators, enter a Category name and a Value (number), then click Add data point. Reorder categories by dragging the handle next to a data point — the order is how they appear in charts and tables.
Rollup
A Rollup indicator computes its data from child Performance Indicators instead of direct entry. The children must be Time-based (Numeric) and share the same unit — mismatches are flagged on the Data tab.
- Under Rolled Up Performance Indicators, click Add — or drag Performance Indicators from the repository tree into the list.
- In the Choose Objects dialog, search by name, or turn on Show Tree and pick from the repository tree. Click Confirm selection.
- Choose how the children combine:
- Aggregation Method — how the children's values merge into the rollup: Average, High, Low, or Sum.
- Period — the time bucket of the rollup series: Hourly to Yearly.
- Child Aggregation — how each child's own data points are condensed within a period before merging: Average, Open, High, Low, Close, or Sum.
- Data Collection — Current period reports up to today (the columns read, for example, This Month and Last Month, and show empty when a period has no data yet); Last data point reports up to the newest available value (the columns read Current and Previous). Use Current period when data arrives automatically and a gap should be visible immediately.
The table below the settings lists the rollup value and each child's contribution; the computed data series appears under Data.
Scheduled report
A Scheduled Report indicator stores the result count of a list report as a nightly data point:
- On the Data tab, choose the report to run. Only list-type reports are supported.
- Choose the user the report runs as.
The report runs at midnight (server time) each night, and the number of results is stored as that day's value. If no report is selected, the report has an error, or the run-as user doesn't exist, no data point is collected for that night.
Comment on a data point
Comments annotate the data series — for example, to record why a value dipped. Adding one requires the Add Diagram Comments item permission on the indicator (the permission also covers Performance Indicator and Chart comments — see Roles and Permissions).
- Open the indicator's Chart tab — or any Chart object that plots the indicator — and click the data point.
- The Comments dialog opens on the Add to performance indicator tab, with the indicator and the point's date pre-filled. To comment on the indicator as a whole instead of one date, clear Comment specific date.
- Type the comment and click Add comment.
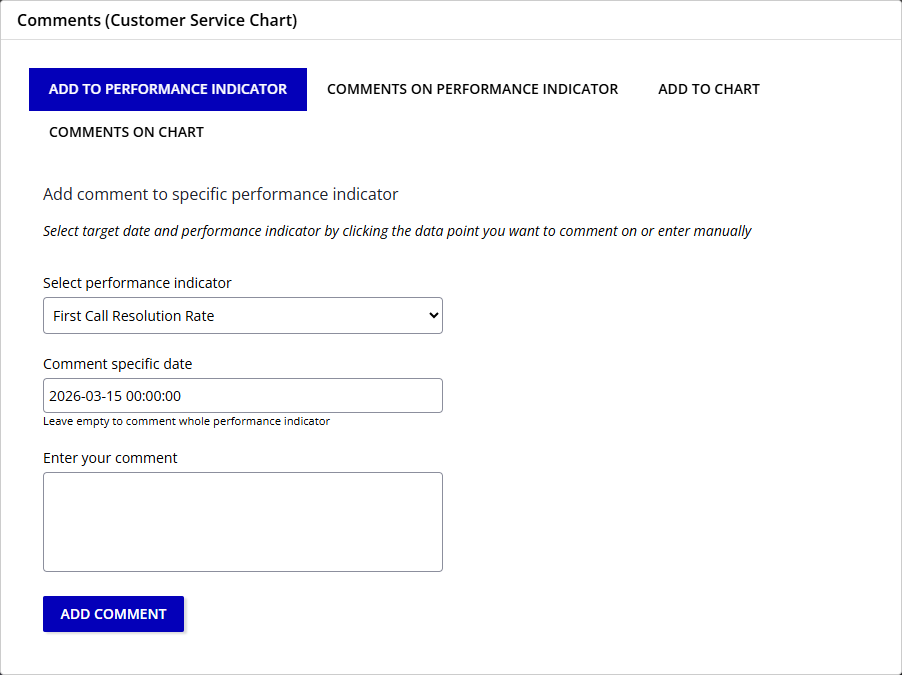
The comment shows as a numbered flag pinned to the series at that date; pointing at the flag shows the author and text. The Comments on performance indicator tab of the same dialog lists every comment on the indicator, with Delete if you can modify the indicator. On a Chart object, the dialog can also carry comments on the chart itself — see Comment on the chart.
Verify
Open the Performance Indicator tab: the Performance section shows the newest value as Current and the one before it as Previous. For numeric data, the Chart tab plots the series.
Related
- Performance management — data types, ratings, and how rollup aggregation relates to traffic-light aggregation
- Create a performance indicator
- Create a chart
- Create a table