Work with external data
An External Data object holds tabular data uploaded from a spreadsheet. Whatever uses it — a simulation's external data generator or a diagram's custom property values — always reads the most recent upload, so you refresh the data in one place.
Prerequisites
- The External Data feature, enabled by a server administrator under Admin → Server Settings → Early Access (the External Data feature flag).
- The Create item permission on the folder that will hold the object.
Steps
Create an External Data object
- Select the destination folder, then Add Object, and choose the type External Data.
- Open the new object and upload the first data: click Upload File or drag a file in. Accepted formats are XLS/XLSX, CSV, TSV, and TXT, up to 32 MB. iGrafx can't read a password-protected or otherwise locked spreadsheet, so remove the protection before you upload it.
The uploaded table displays on the object's page.
Update the data
Open the object and select Update, then upload the newer file. The latest version displays; the Data as of dropdown lists earlier uploads by date and time so you can review them. Consumers of the object use the most recent version automatically.
Drive a simulation with external data
A simulation's External Data Generator creates cases from the rows of an External Data object — the file needs a "Time" column. See External Data Generator.
Feed diagram custom properties
In a web diagram, the File menu's External Data → Add external data wizard maps columns of an External Data (or External File) object to diagram-defined custom properties:
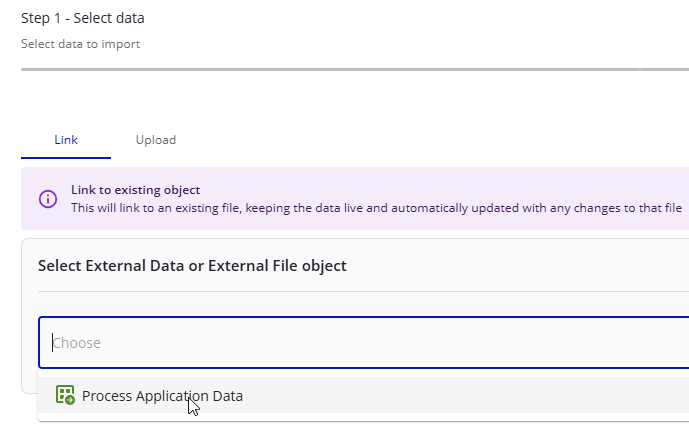
- Select Data — choose Link to stay connected to a repository object (the diagram follows future check-ins) or Upload for one-time data, then pick the source.
- Select Key — choose the key column whose values match shape names; a matching column is often autodetected.
- Properties — map columns to existing diagram-defined custom properties, create new ones from the column names, or ignore columns.
- Review and click Finish. Rows whose key matches a shape name fill that shape's property values; you can map shapes without a match manually.
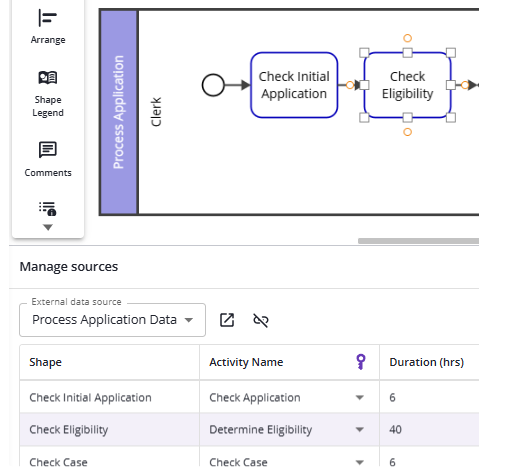
Manage the connection from the menu next to Add external data. The Manage sources panel shows the current source and how rows map to shapes — selecting a shape highlights its row, and the other way round. From the panel you can switch between linked sources, open the source in a new tab, or unlink it; unlinking removes that source's data from the diagram.