Mining variant overlay
Mining variantVariant A unique trace pattern in an event log. Variant analysis ranks how often each path is taken and is the fastest way to spot process deviation. overlay shows data from a Process MiningProcess Mining A discipline that uses event data recorded by enterprise systems to discover, monitor, and improve real business processes — revealing how work actually flows rather than how it was designed. project on top of a web diagram, so you can compare what the diagram documents against what the mining data actually shows.
This is an Early Access feature — see Early Access and General Access for how an administrator enables it.
Prerequisites
- Project-admin access to at least one Process MiningProcess Mining A discipline that uses event data recorded by enterprise systems to discover, monitor, and improve real business processes — revealing how work actually flows rather than how it was designed. project that contains data.
- A web diagram that Process MiningProcess Mining A discipline that uses event data recorded by enterprise systems to discover, monitor, and improve real business processes — revealing how work actually flows rather than how it was designed. can interpret (any diagram qualifies).
Steps
-
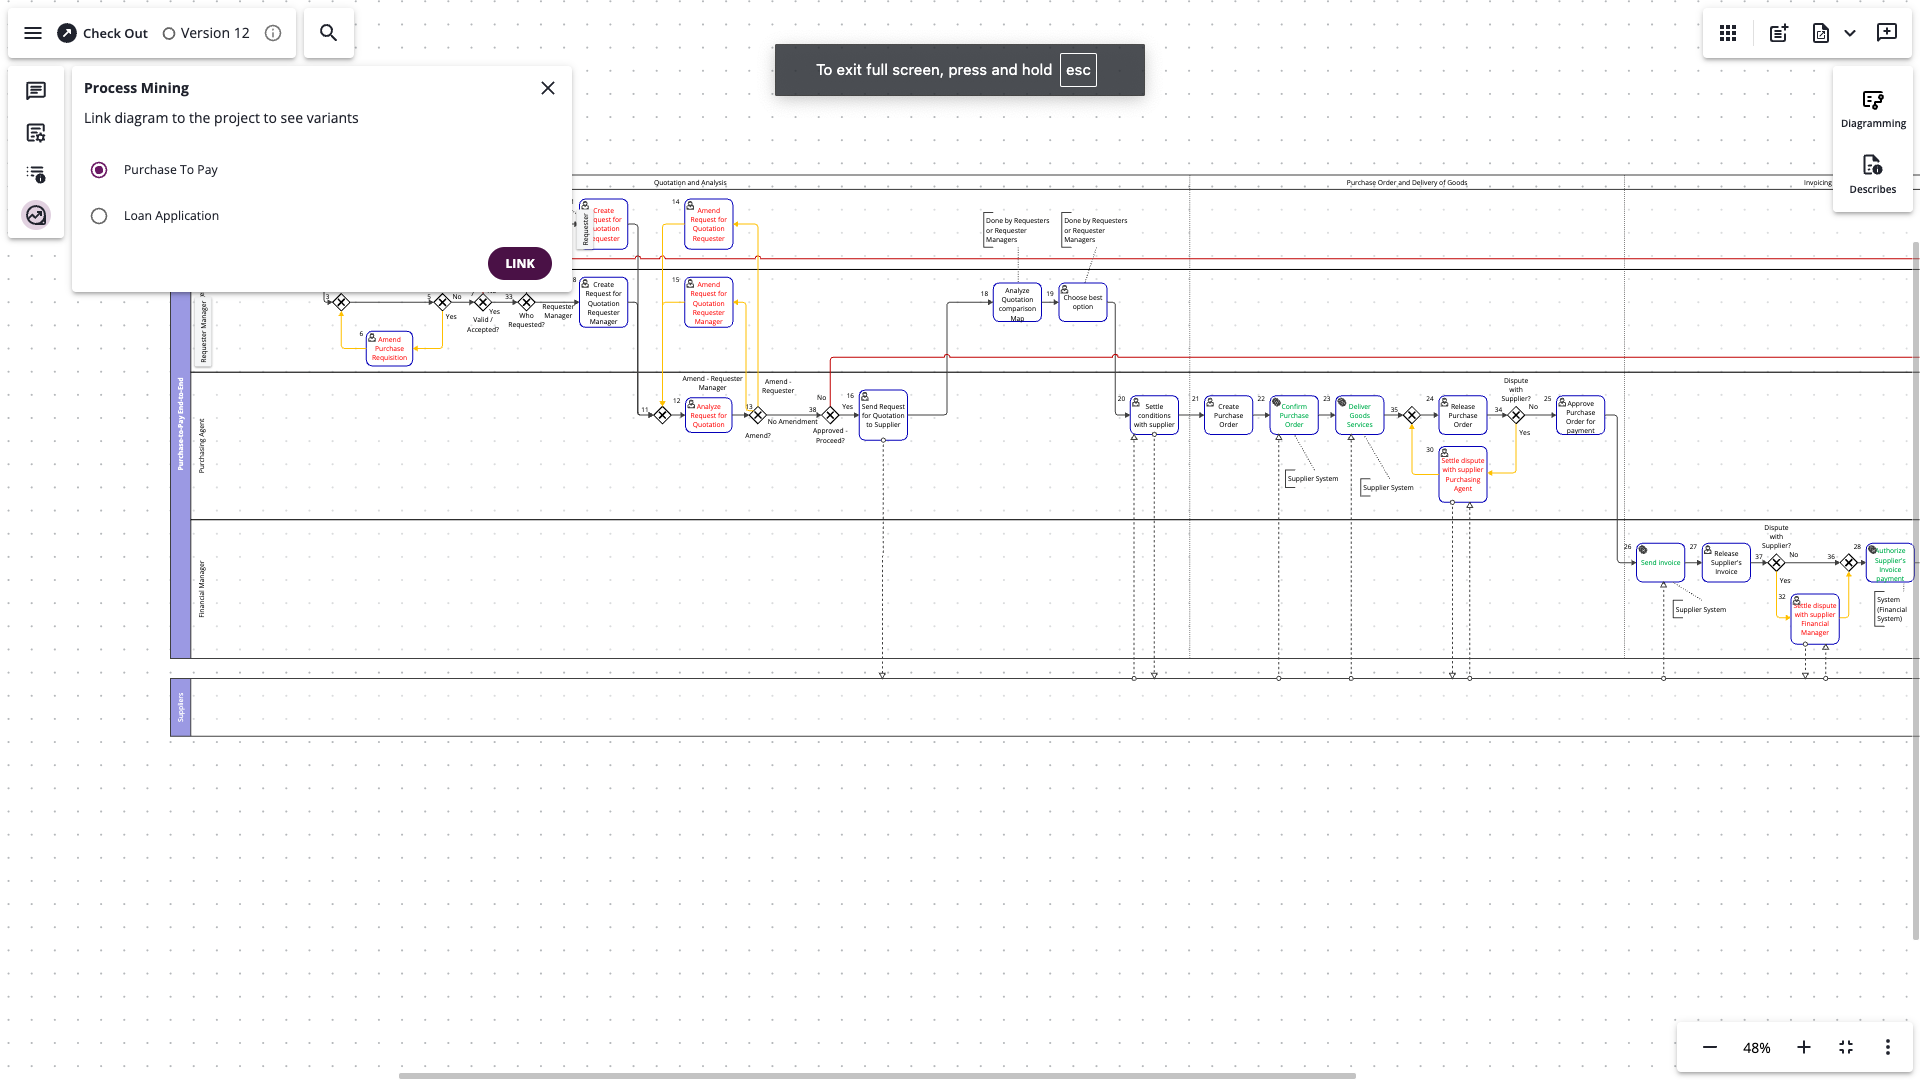
Open a web diagram and open the Process MiningProcess Mining A discipline that uses event data recorded by enterprise systems to discover, monitor, and improve real business processes — revealing how work actually flows rather than how it was designed. sidebar panel. It lists the projects you have admin rights to.
-
Select a project and click Link.
-
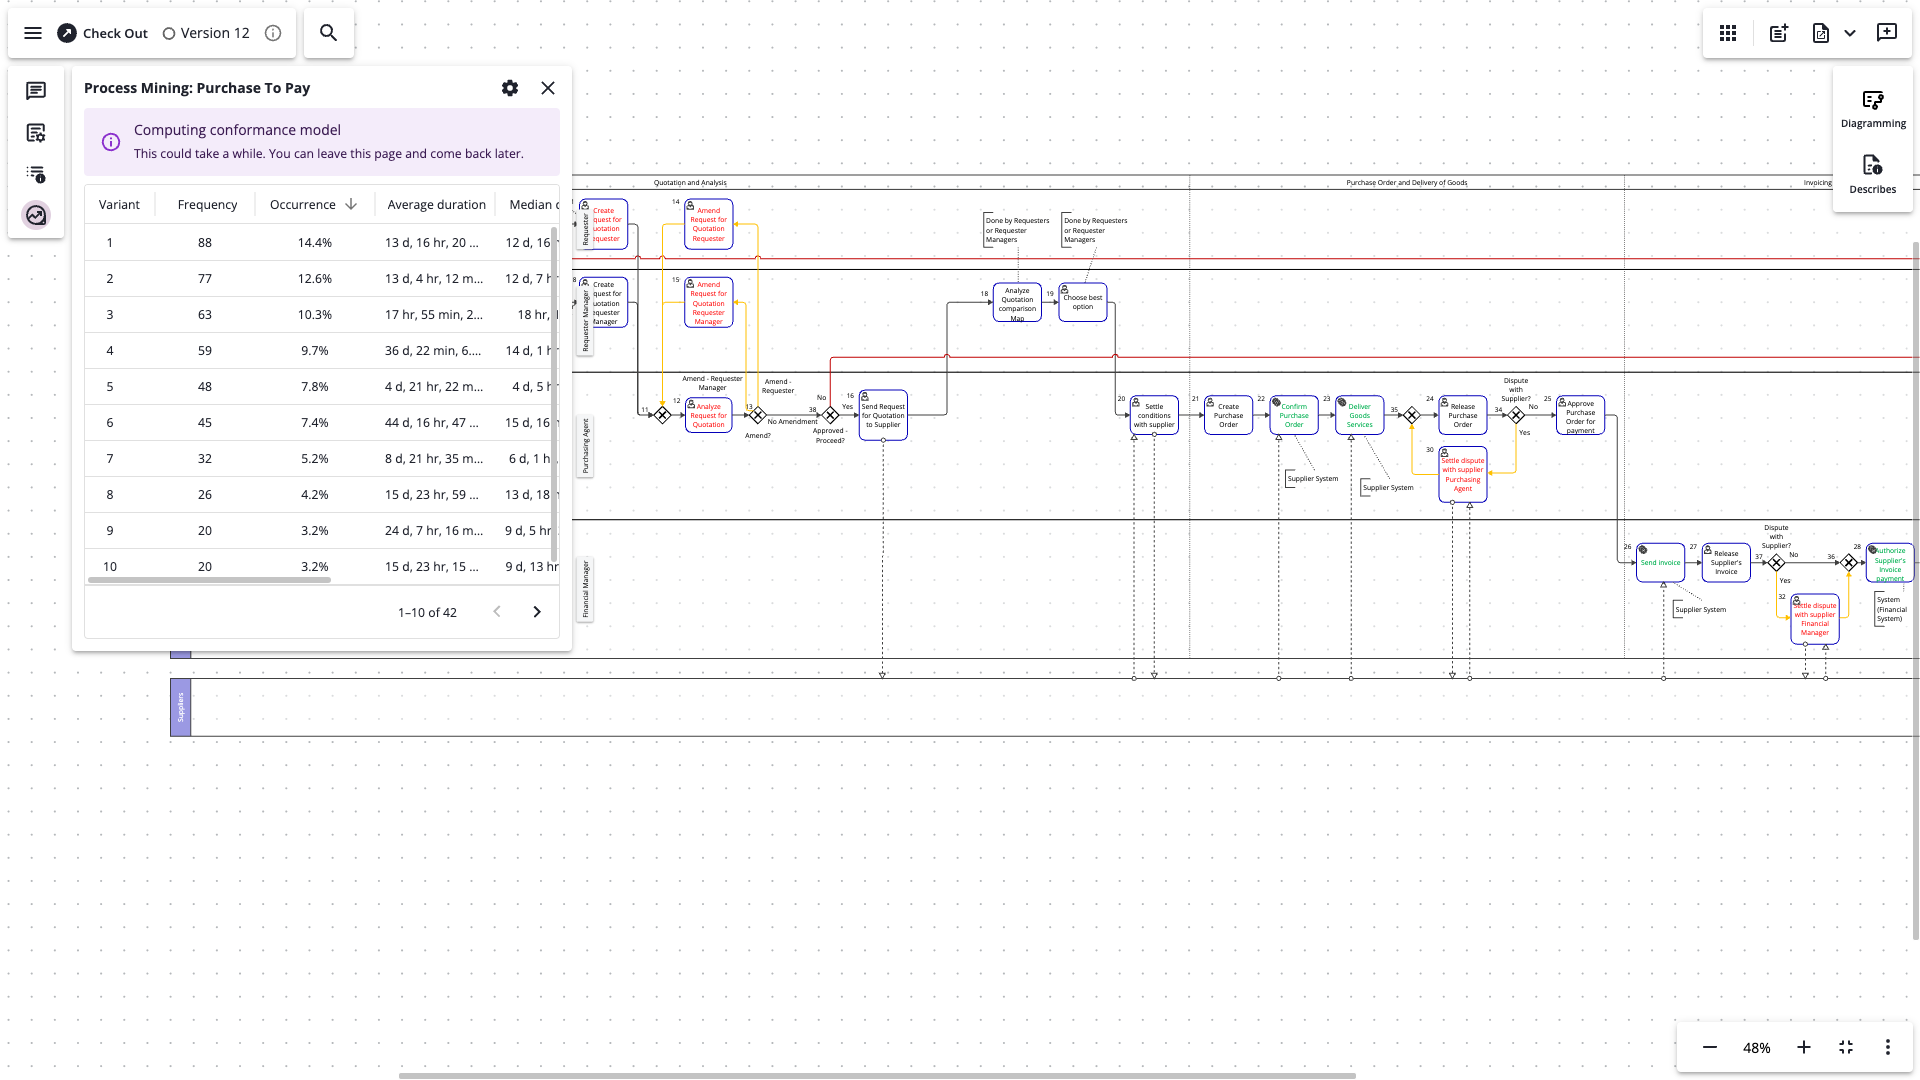
Wait for the conformance model to compute. This can take a while depending on the size of the project and the diagram, and it continues even if you close the application. While you wait, you can browse the project's variantsVariant A unique trace pattern in an event log. Variant analysis ranks how often each path is taken and is the fastest way to spot process deviation. and statistics.
-
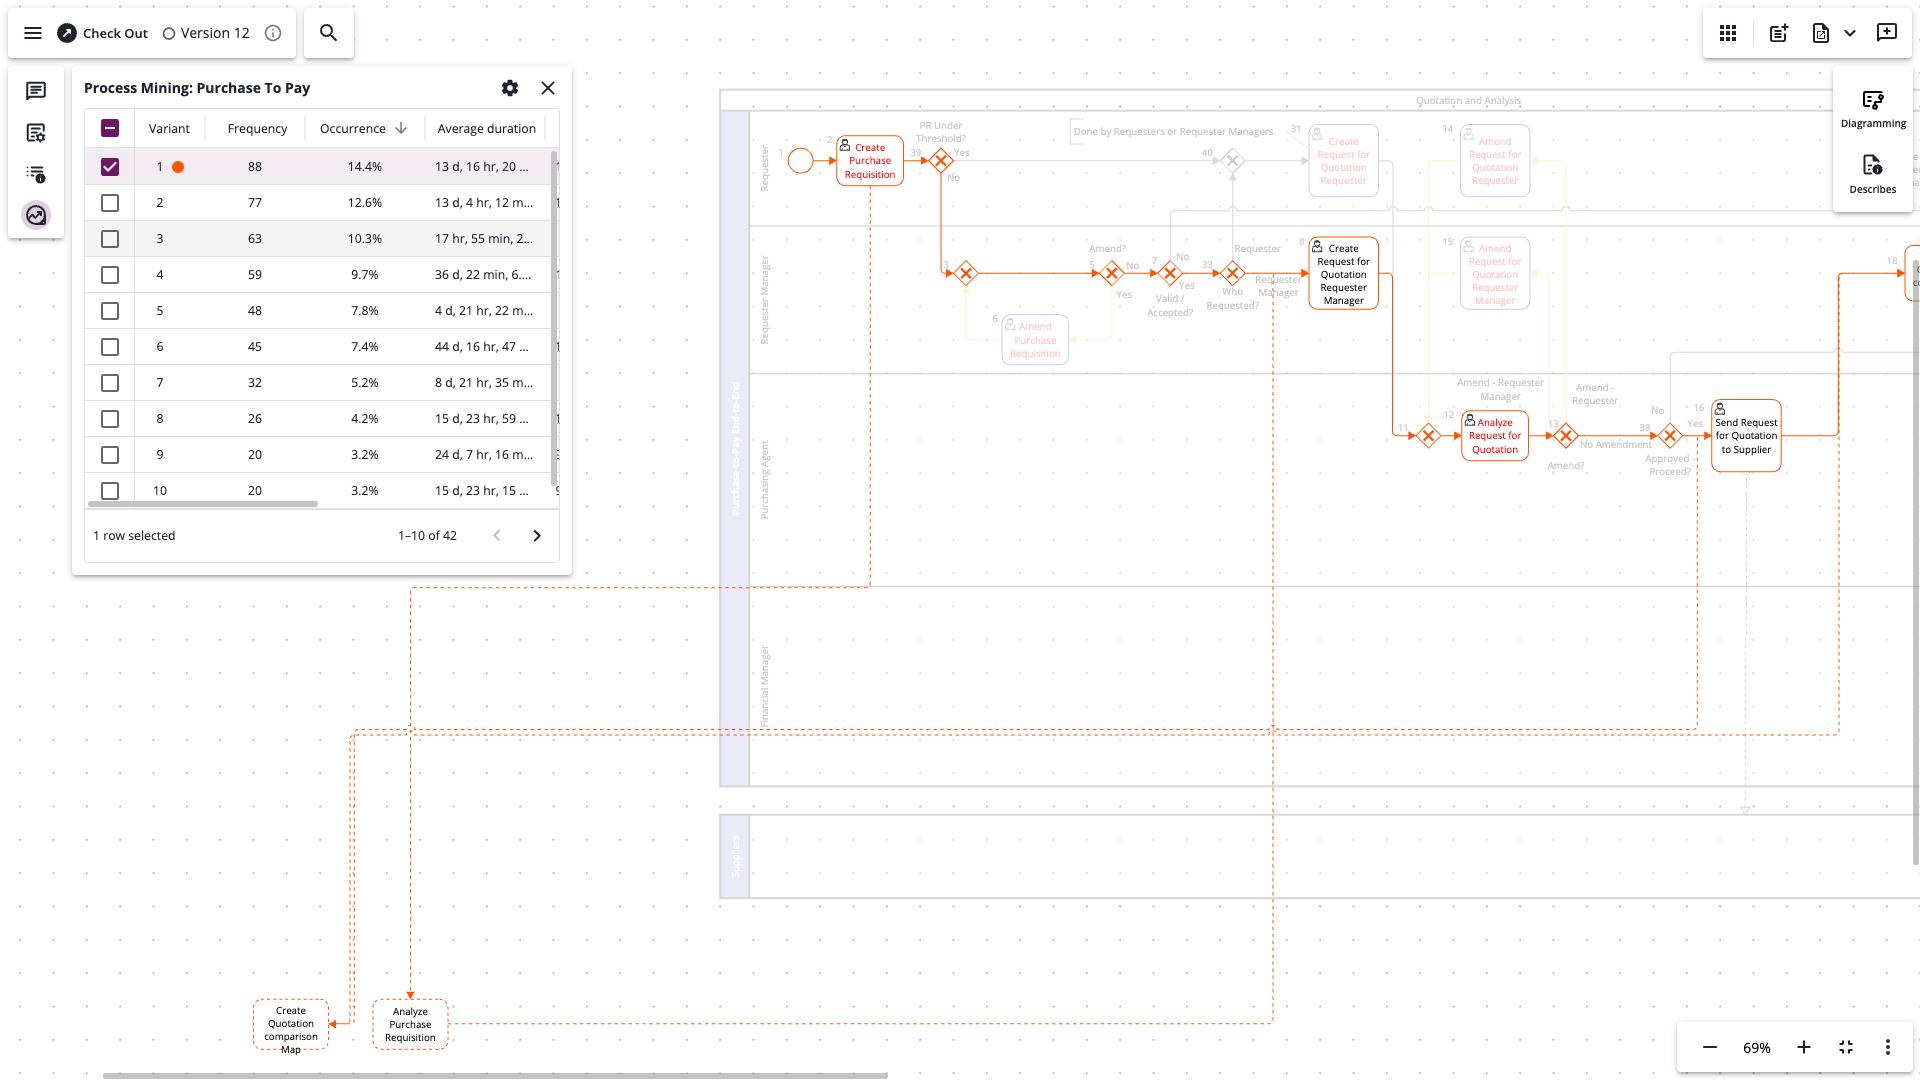
When the model finishes, checkboxes appear in the variantsVariant A unique trace pattern in an event log. Variant analysis ranks how often each path is taken and is the fastest way to spot process deviation. list. Select a variantVariant A unique trace pattern in an event log. Variant analysis ranks how often each path is taken and is the fastest way to spot process deviation. to overlay it.
The overlay shows:
- Tasks in the mining project but not in the diagram — drawn with a dashed border at the bottom of the diagram.
- Connections not in the diagram — drawn with a dashed line.
- Tasks and connections in the diagram that don't occur in the variantVariant A unique trace pattern in an event log. Variant analysis ranks how often each path is taken and is the fastest way to spot process deviation. — faded out.
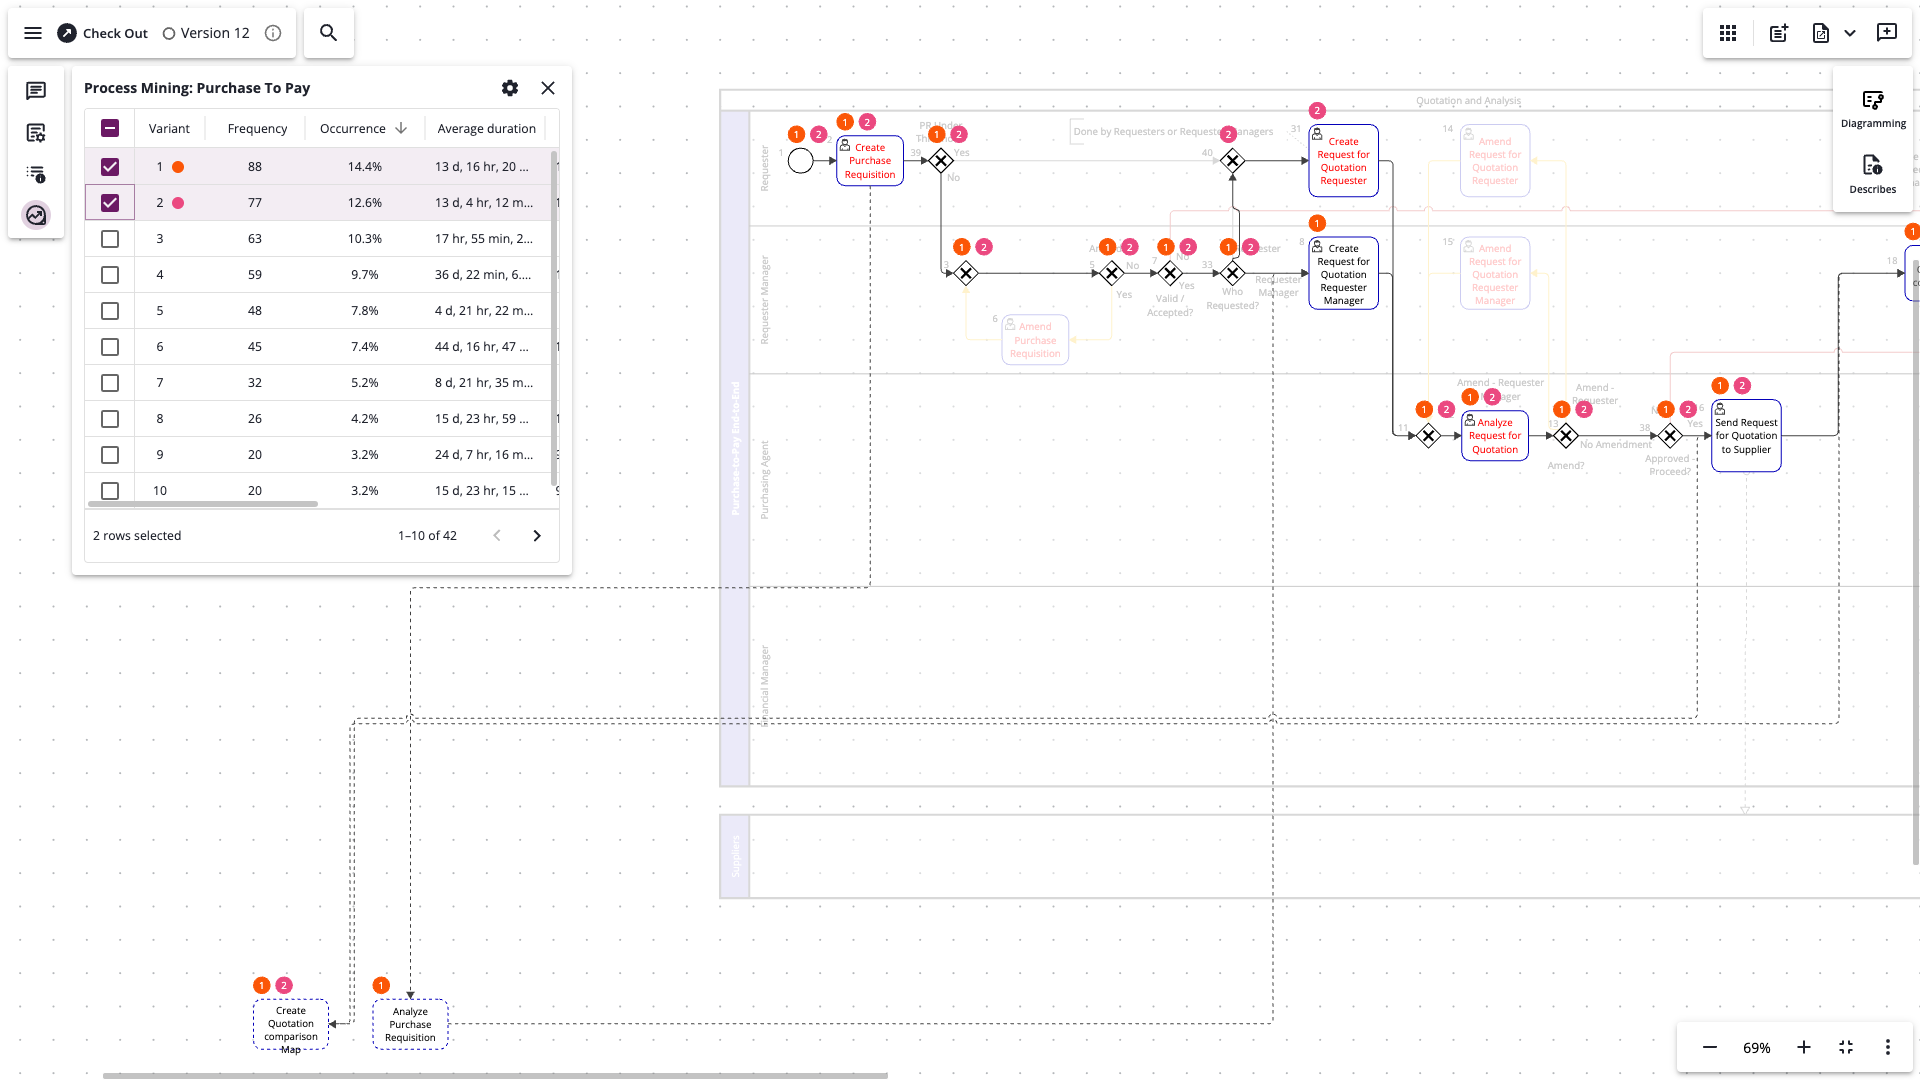
Select several variantsVariant A unique trace pattern in an event log. Variant analysis ranks how often each path is taken and is the fastest way to spot process deviation. at once; each gets a unique name and color shown above the tasks it includes.
Manage the linked model and statistics
-
The link creates a model in Process MiningProcess Mining A discipline that uses event data recorded by enterprise systems to discover, monitor, and improve real business processes — revealing how work actually flows rather than how it was designed., viewable from the project's settings page. When a new diagram version is checked in, the model updates.
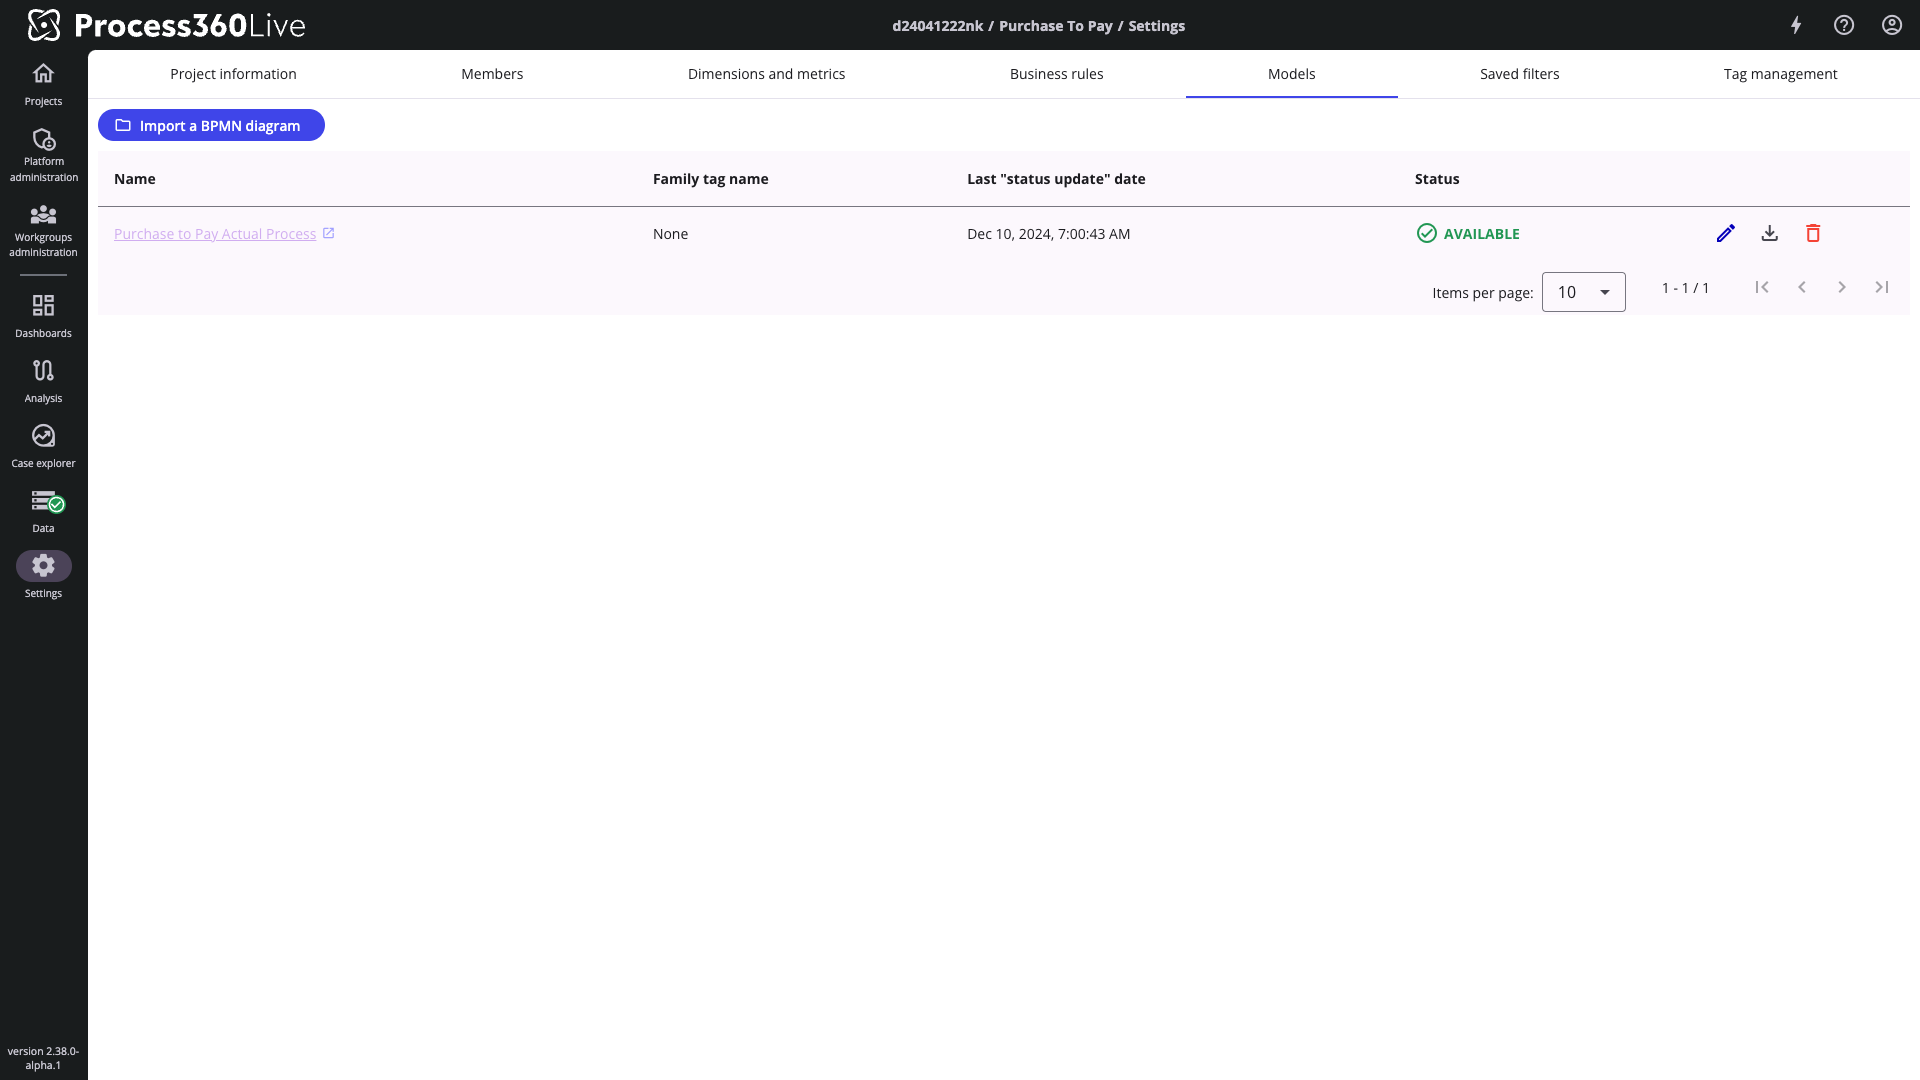
-
Adjust the displayed statistics by hovering a column header, selecting the three-dot menu, and choosing Manage columns. Drag a column header to reorder.
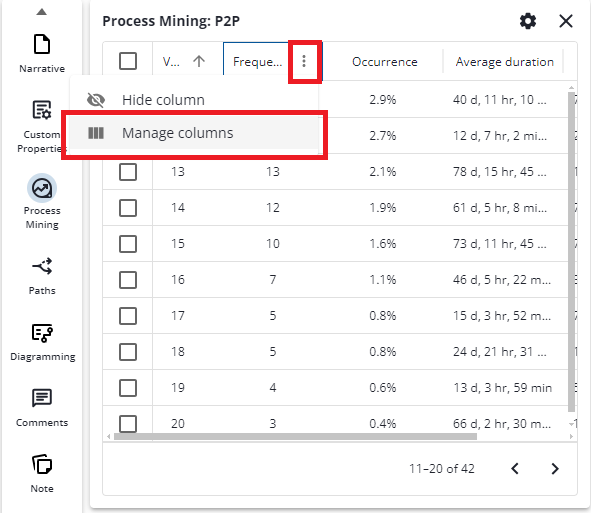
How activities are matched
The overlay matches diagram activities to mining activities by comparing the activityActivity A named step in a process (e.g. "Approve Invoice"). Each event in an event log records one activity occurrence for one case. name in the diagram with the activityActivity A named step in a process (e.g. "Approve Invoice"). Each event in an event log records one activity occurrence for one case. name in the Process MiningProcess Mining A discipline that uses event data recorded by enterprise systems to discover, monitor, and improve real business processes — revealing how work actually flows rather than how it was designed. logs. If a name doesn't match in both places, the overlay represents it as a new activityActivity A named step in a process (e.g. "Approve Invoice"). Each event in an event log records one activity occurrence for one case. based on the mining name.